Document updated on Mar 8, 2024
Prometheus’ metrics endpoint

Prometheus is an open-source system monitoring and alerting toolkit that you can use to scrape a /metrics endpoint on KrakenD in the selected port. For instance, you could have an endpoint like http://localhost:9091/metrics.
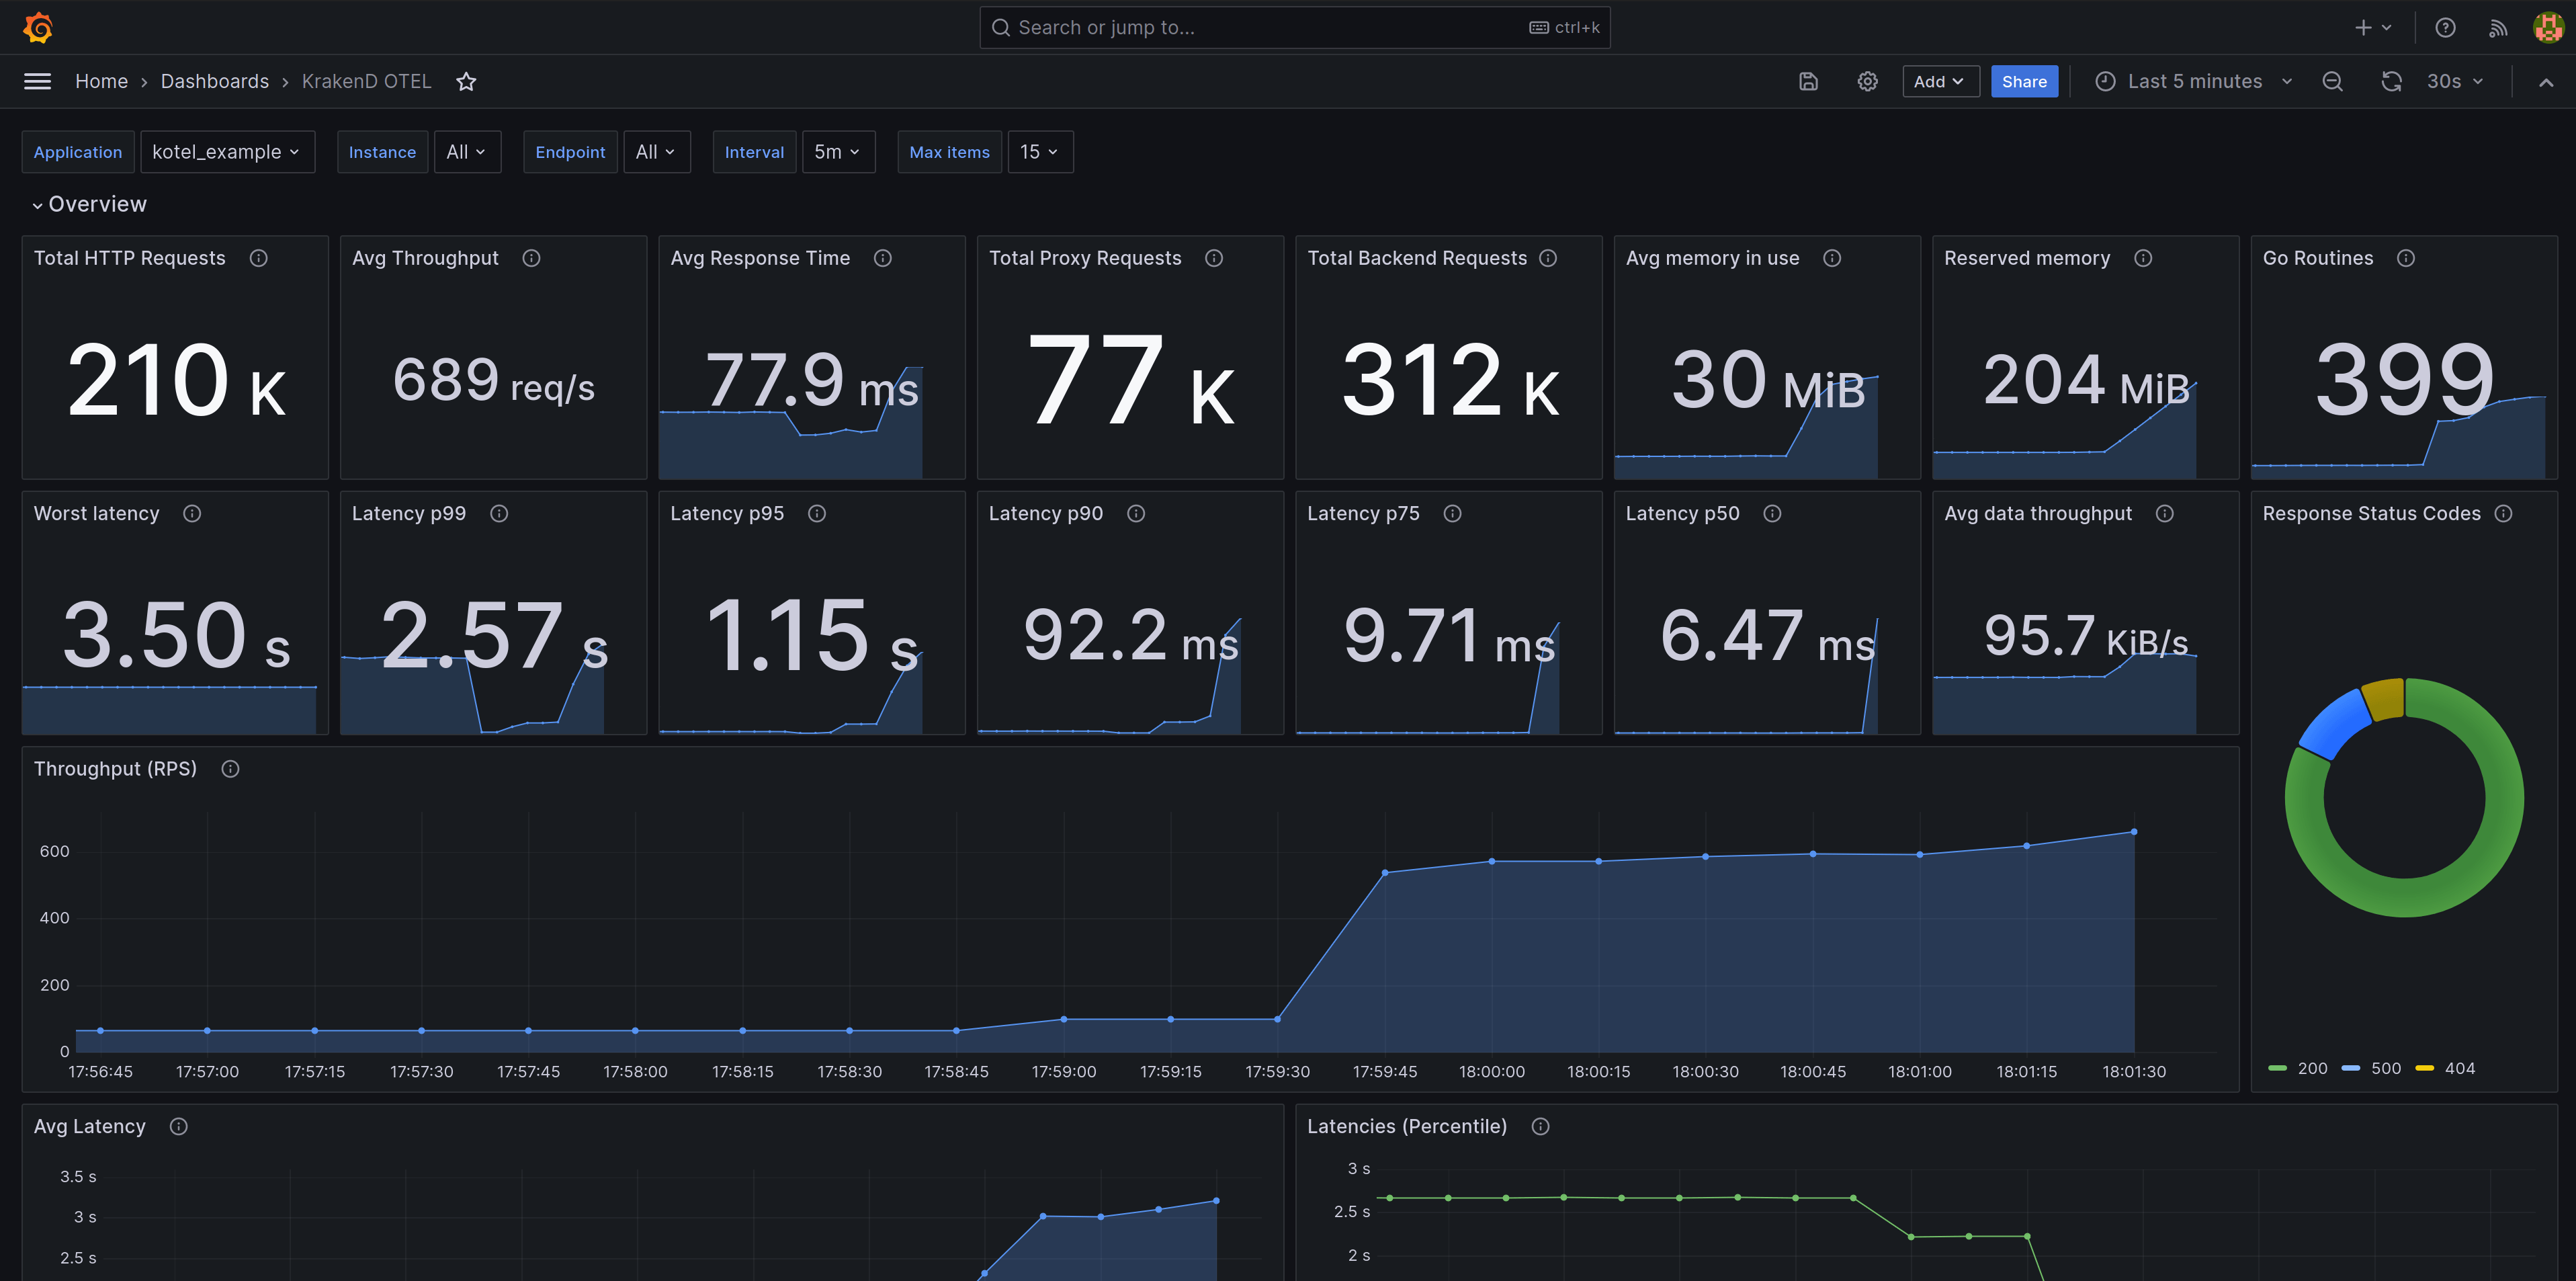
When using Prometheus with OpenTelemetry, you can use a ready-to-use Grafana dashboard to visualize metrics, as shown in the image above.
The mechanics are simple: you add the telemetry/opentelemetry integration with a prometheus exporter, and then you add a Prometheus job to scrape from your KrakenD instances the metrics.
Prometheus Configuration
To enable scrapable Prometheus metrics on Krakend, add the OpenTelemetry integration with a prometheus exporter. The following configuration is an example of how to do it:
{
    "version": 3,
    "extra_config": {
        "telemetry/opentelemetry": {
            "service_name": "krakend_prometheus_service",
            "metric_reporting_period": 1,
            "exporters": {
                "prometheus": [
                    {
                        "name": "local_prometheus",
                        "port": 9090,
                        "process_metrics": true,
                        "go_metrics": true
                    }
                ]
            }
        }
    }
}
The full list of the Prometheus exporter settings are as follows:
Fields of "telemetry/opentelemetry": { "exporters":{} }
prometheusarray- Set here at least the settings for one Prometheus exporter. Each exporter will start a local port that offers metrics to be pulled from KrakenD.Each item of prometheus accepts the following properties:
disable_metricsboolean- Leave this exporter declared but disabled (useful in development). It won’t report any metrics when the flag is
true.Defaults tofalse go_metricsboolean- Whether you want fine-grained details of Go language metrics or not.
listen_ipstring- The IP address that KrakenD listens to in IPv4 or IPv6. You can, for instance, expose the Prometheus metrics only in a private IP address. An empty string, or no declaration means listening on all interfaces. The inclusion of
::is intended for IPv6 format only (this is not the port). Examples of valid addresses are192.0.2.1(IPv4),2001:db8::68(IPv6). The values::and0.0.0.0listen to all addresses, which are valid for IPv4 and IPv6 simultaneously.Examples:"172.12.1.1","::1"Defaults to"0.0.0.0" name* string- A unique name to identify this exporter.Examples:
"local_prometheus","remote_grafana" portinteger- The port in KrakenD where Prometheus will connect to.Defaults to
9090 process_metricsboolean- Whether this exporter shows detailed metrics about the running process like CPU or memory usage or not.
In addition, you can do a granular configuration of the metrics you want to expose using the layers attribute and other OpenTelemetry options.
Demonstration setup
The following configuration allows you to test a complete metrics experience, from generation and collection to visualization. The first code snippet is a docker-compose.yaml that declares three different services:
- The
krakendservice exposing port 8080 - The
prometheusservice that will scrape the metrics from KrakenD - A
grafanadashboard to display them (it uses our Grafana dashboard)
Notice that the three services declare volumes to pick the configuration.
version: "3"
services:
  krakend:
    image: "krakend:2.6"
    ports:
      - "8080:8080"
    volumes:
      - "./krakend:/etc/krakend/"
  prometheus:
    image: prom/prometheus:latest
    ports:
      - "9090:9090"
    volumes:
      - "./prometheus.yml:/etc/prometheus/prometheus.yml"
  grafana:
    image: grafana/grafana:latest
    ports:
      - "3000:3000"
    environment:
      GF_SECURITY_ADMIN_USER: krakend
      GF_SECURITY_ADMIN_PASSWORD: krakend
      GF_AUT_ANONYMOUS_ENABLED: "true"
    volumes:
      - "./conf/provisioning/datasources:/etc/grafana/provisioning/datasources"
      - "./conf/provisioning/dashboards:/etc/grafana/provisioning/dashboards"
      - "./conf/data/dashboards:/var/lib/grafana/dashboards"
The following YAML configuration is a simple example of pulling data from the /metrics endpoint in KrakenD integration from three different instances:
localhost as a target because the Prometheus container does not run inside the KrakenD container; use the service name instead.global:
scrape_interval: 15s
rule_files:
# - "first.rules"
# - "second.rules"
scrape_configs:
- job_name: krakend_otel
scrape_interval: 5s
metrics_path: '/metrics'
static_configs:
- targets:
- 'krakend1:9091'
- 'krakend2:9091'
- 'krakend3:9091'
labels:
app: kotel_example
Visualizing metrics in a dashboard
When the Prometheus configuration is added into KrakenD, and your Prometheus is scrapping it, you can visualize the data using our Grafana dashboard or make your own.
layers are disabled by default. Enable the options that matter to you, knowing that the more detail you add, the more resources the gateway will need to run.
Migrating from an old OpenCensus configuration (legacy)
Prior to KrakenD v2.6, you had to configure the Prometheus endpoint using the opencensus component. The OpenTelemetry integration is much more powerful and delivers more data while simultaneously giving you more configuration options.
If you had an OpenCensus configuration with a prometheus exporter like the following:
{
  "version": 3,
  "extra_config": {
    "telemetry/opencensus": {
        "sample_rate": 100,
        "reporting_period": 0,
        "exporters": {
          "prometheus": {
              "port": 9091,
              "namespace": "krakend",
              "tag_host": false,
              "tag_path": true,
              "tag_method": true,
              "tag_statuscode": false
          }
      }
    }
  }
}
Then you should make the following changes to upgrade:
telemetry/opencensus-> Rename totelemetry/opentelemetrysample_rate-> Delete this fieldreporting_period-> Rename tometric_reporting_periodprometheus: {...}-> Add an array surrounding the object, so it becomesprometheus: [{...}]namespace-> Rename tonametag_host,tag_path,tag_method,tag_statuscode-> Delete them
From here, add any of the additional properties you can add.

