Document updated on Dec 7, 2022
Azure Monitor Telemetry Integration
Azure Monitor collects, analyzes, and acts on telemetry data from your Azure and on-premises environments. Azure Monitor helps you maximize performance and availability of your applications and proactively identify problems in seconds.
The gateway sends all the traces to a local OpenTelemetry Collector (see repository), allowing the gateway to offload data quickly and the collector can take care of additional handling like retries, batching, encryption or even sensitive data filtering. Finally, the Otel Collector pushes all the data to your Application Insights on Azure Monitor.
Application Insights configuration
The OpenCensus exporter is the (stable) component that allows you to export telemetry data, Azure included. Nevertheless, the official OpenTelemetry Collector is flagged as beta and still does not support pushing metrics for Azure. So without further development on the OpenTelemetry side, the integration is limited to traces.
There are three things you need to do:
- Create the Application Insights resource on Azure
- Start the OpenTelemetry Collector
- Add it to KrakenD’s configuration
Create an Application Insights resource
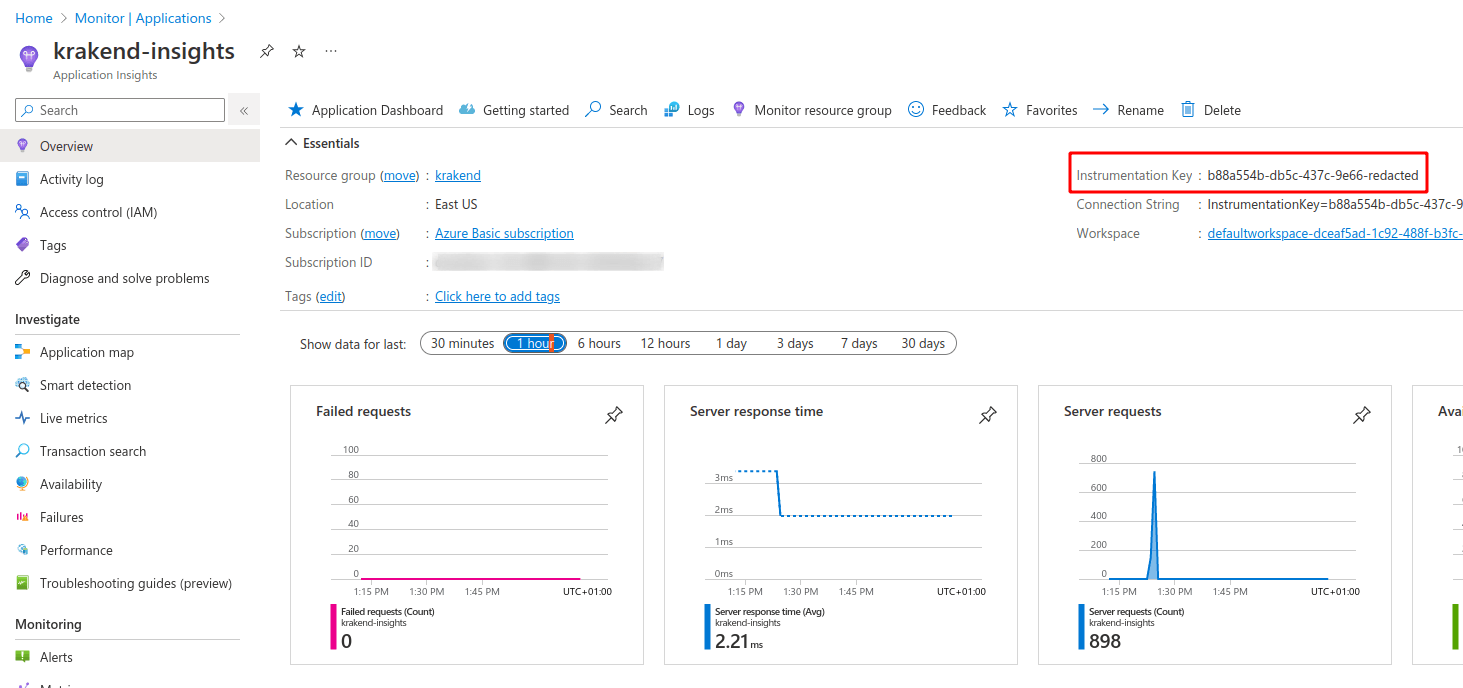
To enable the Azure Monitor integration, you need to add a new resource Application Insights, under your Azure account and fill in the information as required (the details provided during the registration form are not relevant to the configuration).
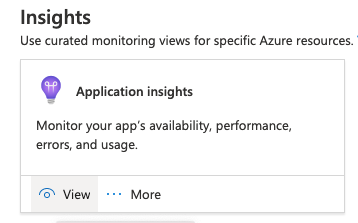
When the resource finishes creating, save the Instrumentation Key for later usage, you will find it as shown in the screenshot below:
Starting the OpenTelemetry Collector
You can start the OpenTelemetry Collector with Azure’s compatibility using its Docker image. Here there is a docker-compose.yml example that includes a KrakenD and a collector:
version: "3"
services:
  krakend:
    image: krakend:2.6
    command: [ "krakend", "run", "-d", "-c", "/etc/krakend/krakend.json"]
    volumes:
      - ./:/etc/krakend
    ports:
      - 8080:8080
  # Collector
  otel-collector:
    image: otel/opentelemetry-collector-contrib
    command: ["--config=/etc/otel-collector.yaml"]
    volumes:
      - ./otel-collector.yaml:/etc/otel-collector.yaml
    ports:
      - "55678"
The configuration mounted for the collector is below, otel-collector.yaml:
receivers:
  opencensus:

exporters:
  # logging:
  #   verbosity: detailed
  azuremonitor:
    instrumentation_key: XXXXXXX

service:
   telemetry:
     logs:
       level: "warn"
  pipelines:
    traces:
      receivers: [opencensus]
      exporters: [azuremonitor]
Enable the logging only if you find problems and want extra information.
Replace the value of the instrumentation_key entry with the one you got in your Azure dashboard.
Configuration for KrakenD
Lastly, add at the service level of KrakenD the following configuration:
{
  "version": 3,
  "extra_config": {
    "telemetry/opencensus": {
          "sample_rate": 100,
          "reporting_period": 60,
          "exporters": {
              "ocagent": {
                "address": "otel-collector:55678",
                "service_name": "myKrakenD",
                "@comment": "Connection to the internal collector is rarely under SSL (insecure flag)",
                "insecure": true
              }
          }
      }
  }
}
The otel-collector above is the name of the docker compose service running the collector. You might need to replace it if you are not using this example.
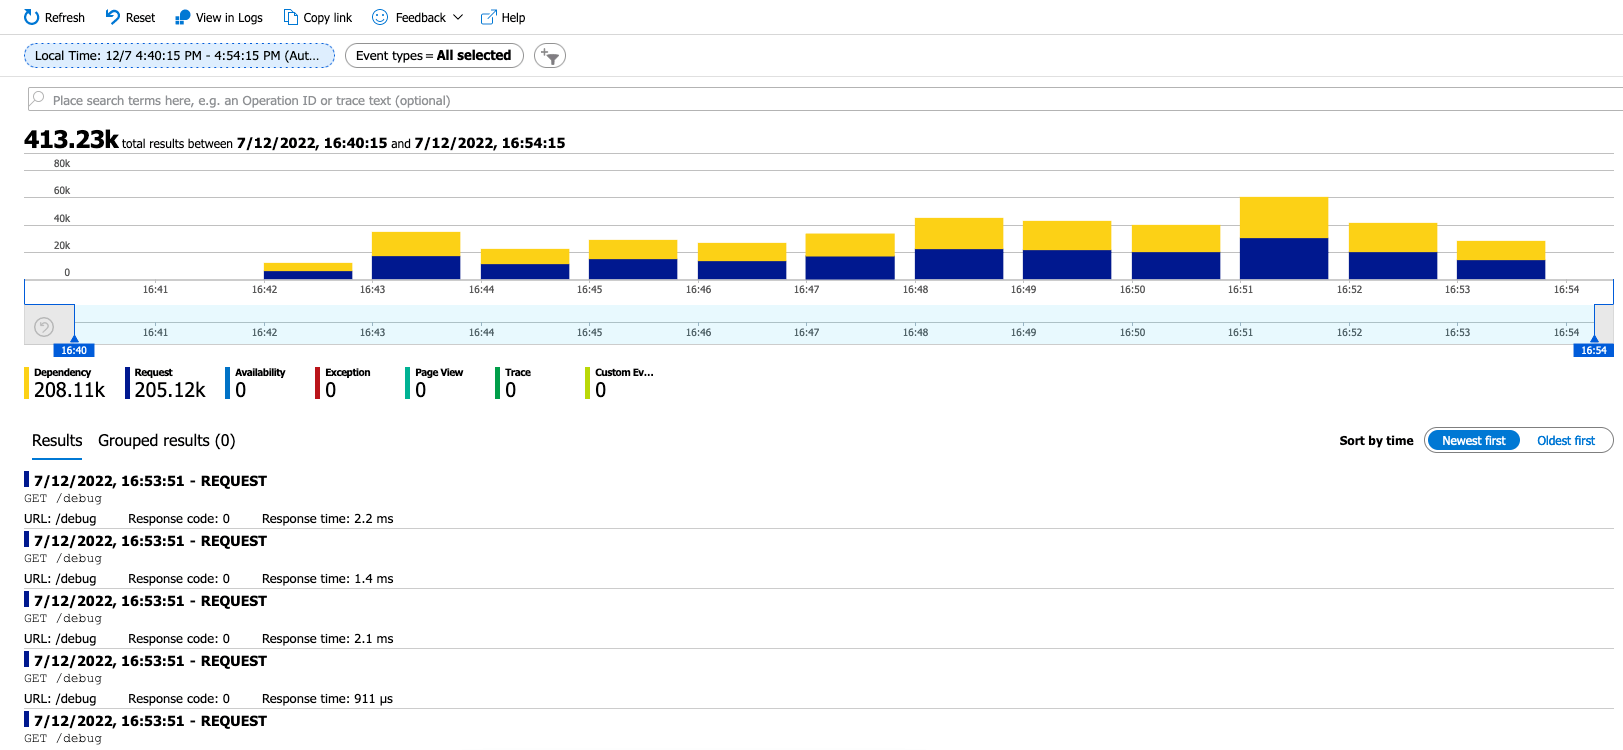
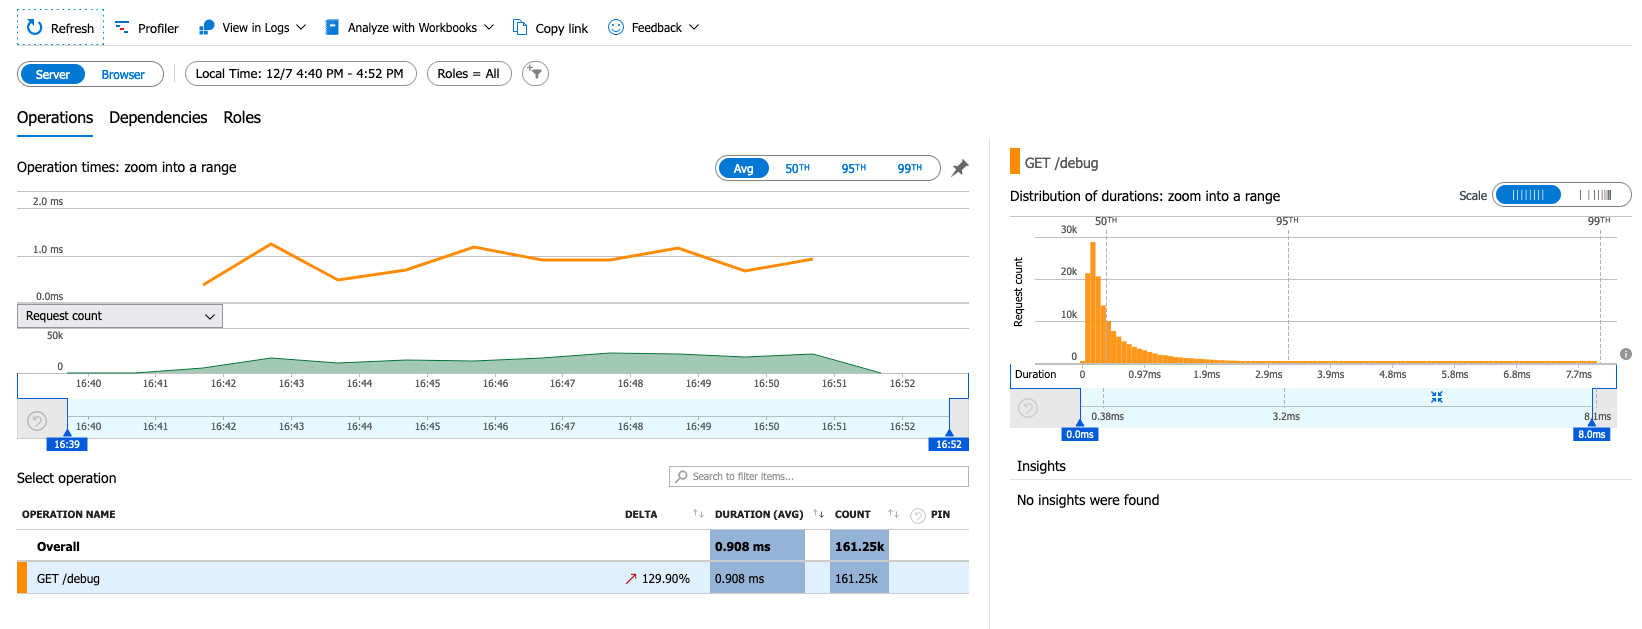
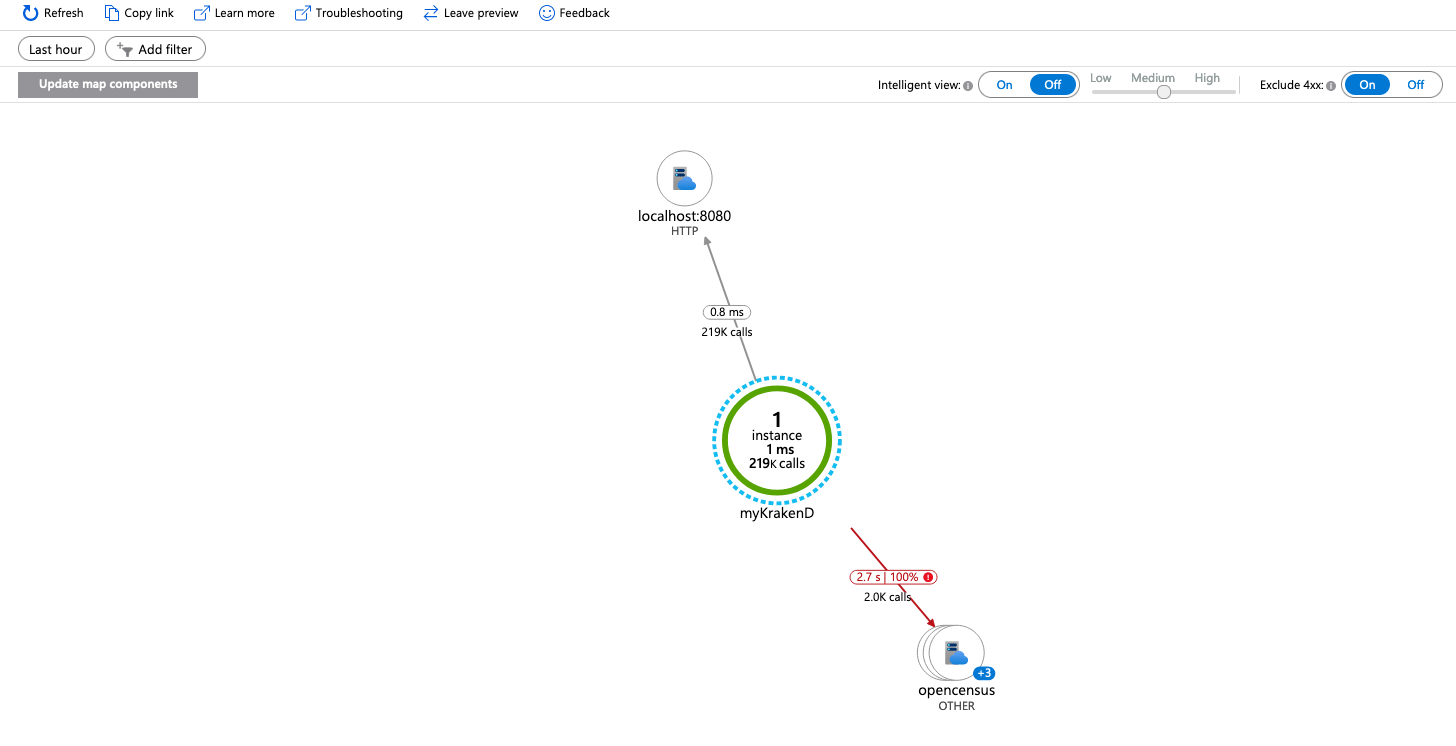
With these three steps, you can start sending data to KrakenD. You should start seeing the graphs populated on Azure Monitor in a couple of minutes.
insecure flag must be set to true. Otherwise, KrakenD will fail silently.Other Resources
- OpenTelemetry Collector Docker Image with Azure support.
- Application Insights
- OpenTelemetry Collector
