Document updated on Sep 28, 2022
Telemetry and Monitoring with Grafana
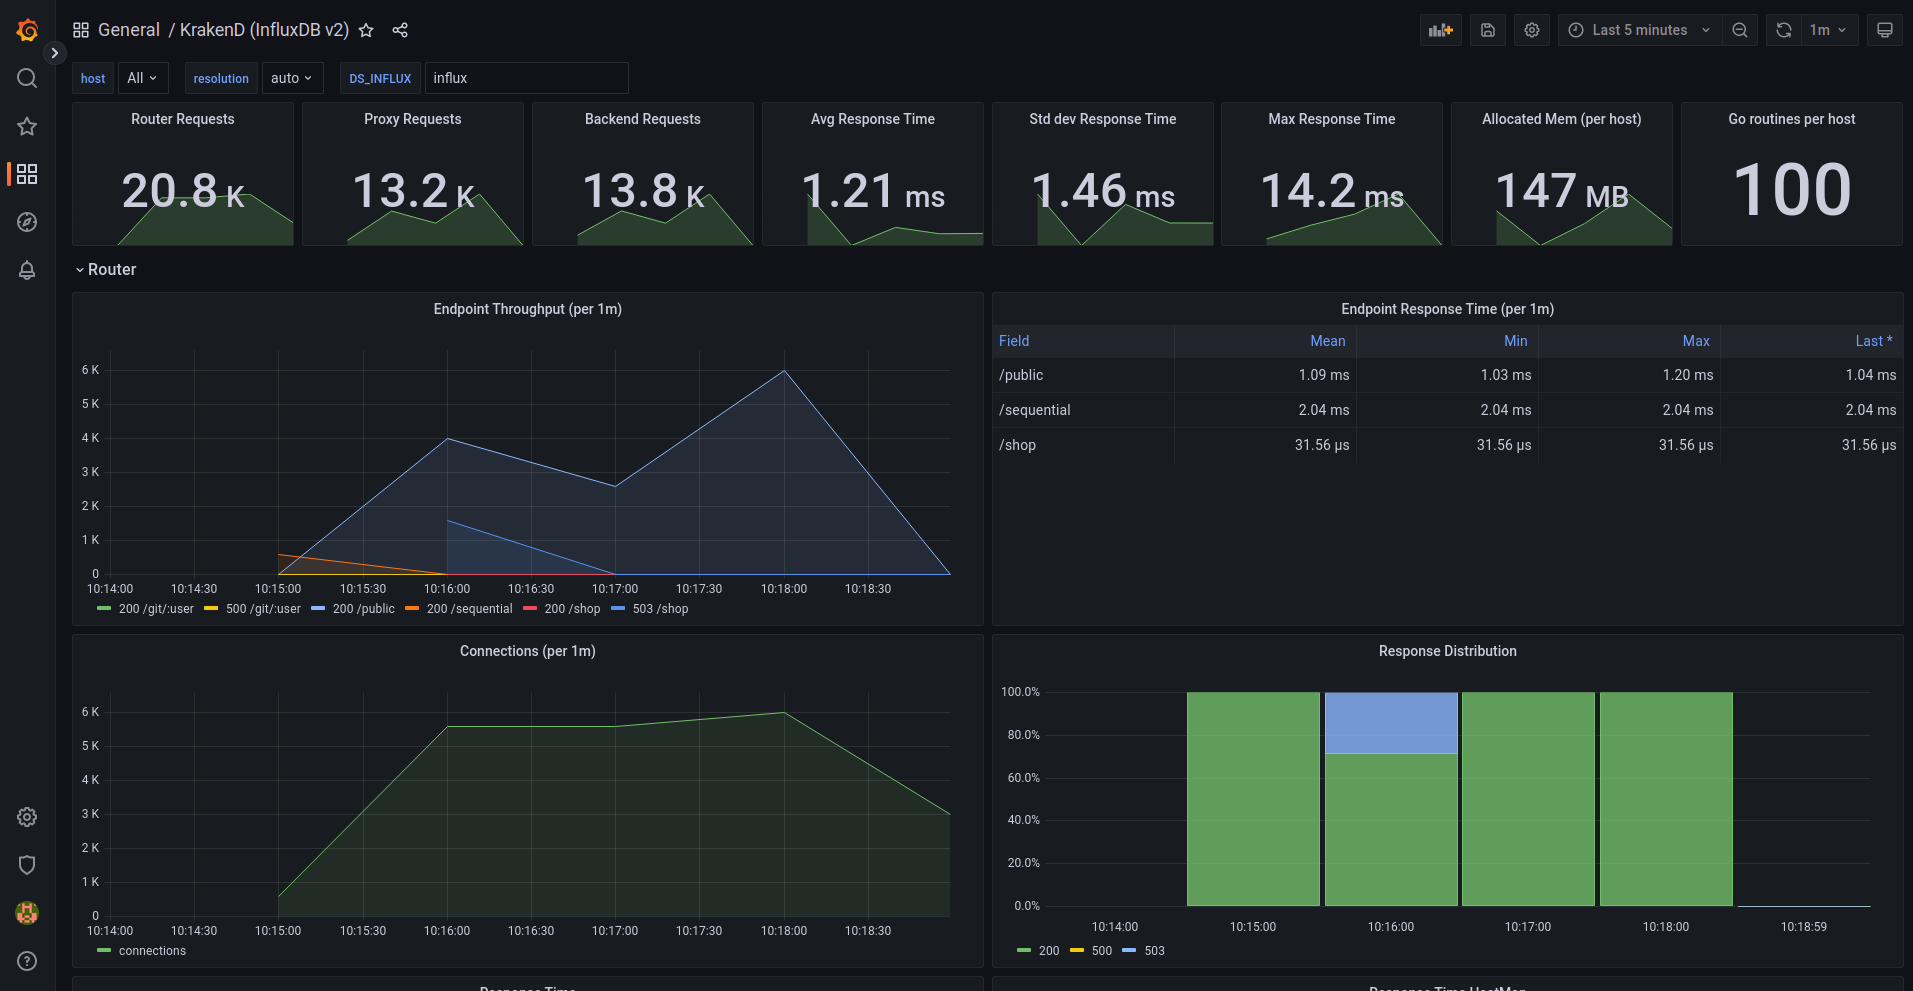
The preconfigured Grafana dashboard for KrakenD offers valuable information to understand the performance of your services and detect anomalies in the service.
The dashboard is extensive and offers you metrics like:
- Requests from users to KrakenD
- Requests from KrakenD to your backends
- Response times
- Memory usage and details
- Endpoints and status codes
- Heatmaps
- Open connections
- Throughput
- Distributions, timers, garbage collection and a long etcetera
Importing a Grafana dashboard
These are the different Grafana data sources you can use for our dashboards:
| Datasource | Description | Cloud ID | Source |
|---|---|---|---|
| InfluxDB v2.x | Latest. Uses Flux queries | 17074 | for-influxdb-v2.json |
| InfluxDB v1.x | Uses InfluxQL queries | 15029 | for-influxdb-v1.json |
To import them, there are several options, being the most common:
- From your Grafana UI, click the
+icon in the side menu, and then click Import. Choose import via Grafana.com and use the IDs above. - From the same UI, import the JSON source files instead
- Copy or mount in your Grafana container the dashboards when starting (Volume content here):
volumes:
  - "./grafana/datasources/all.yml:/etc/grafana/provisioning/datasources/all.yml"
  - "./grafana/dashboards/all.yml:/etc/grafana/provisioning/dashboards/all.yml"
  - "./grafana/krakend:/var/lib/grafana/dashboards/krakend"
You can see an example integrated on KrakenD Playground’s Docker compose file.
Getting the metrics on Grafana
Grafana does not require any specific configuration on KrakenD, but its data source does.
For the data sources listed above, you will need to add the InfluxDb exporterinto your krakend.json, which is a configuration like this:
{
  "version": 3,
  "extra_config": {
    "telemetry/influx": {
      "address": "http://localhost:8086",
      "ttl": "25s",
      "buffer_size": 100,
      "db": "krakend_db",
      "username": "user",
      "password": "password"
    },
    "telemetry/metrics": {
      "collection_time": "30s",
      "listen_address": "127.0.0.1:8090"
    }
  }
}
For more in-depth explanation, see the InfluxDB exporter configuration

