Document updated on Sep 15, 2019
Telemetry

Observability and networking are key to succeed in a scenario of distributed microservices architecture, and new monitoring tools are needed. These tools must provide at least options to detect problems’ root causes, monitoring and details of the different distributed transactions, and performance and latency optimization.
Through the OpenCensus exporters you can send logs, metrics, and traces to several open source and payment tools, so you can follow the activity of the gateway and the derived requests to its connected backends.
Enabling tracing is key to have a good detail of what is going on inside the Gateway and between the user, the Gateway and your services.
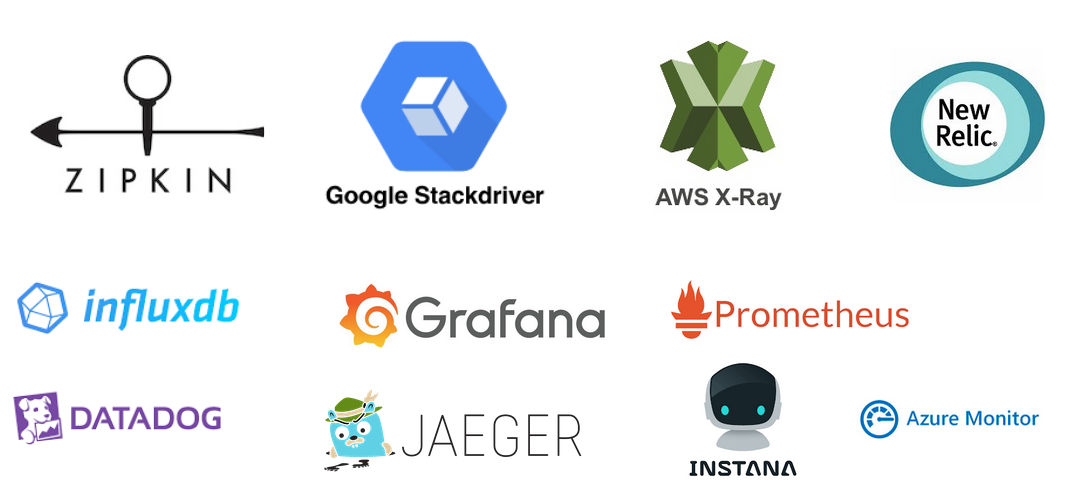
The following telemetry systems are supported:
- Jaeger
- Zipkin
- AWS X-Ray
- InfluxDB
- Prometheus
- Google Stackdriver
- Datadog
- OpenCensus Agent (e.g: Azure Monitor)
- Grafana
- Newrelic (only custom builds)
- Instana (KrakenD Enterprise only)
