Document updated on Sep 28, 2022
Telemetry and Monitoring with Grafana

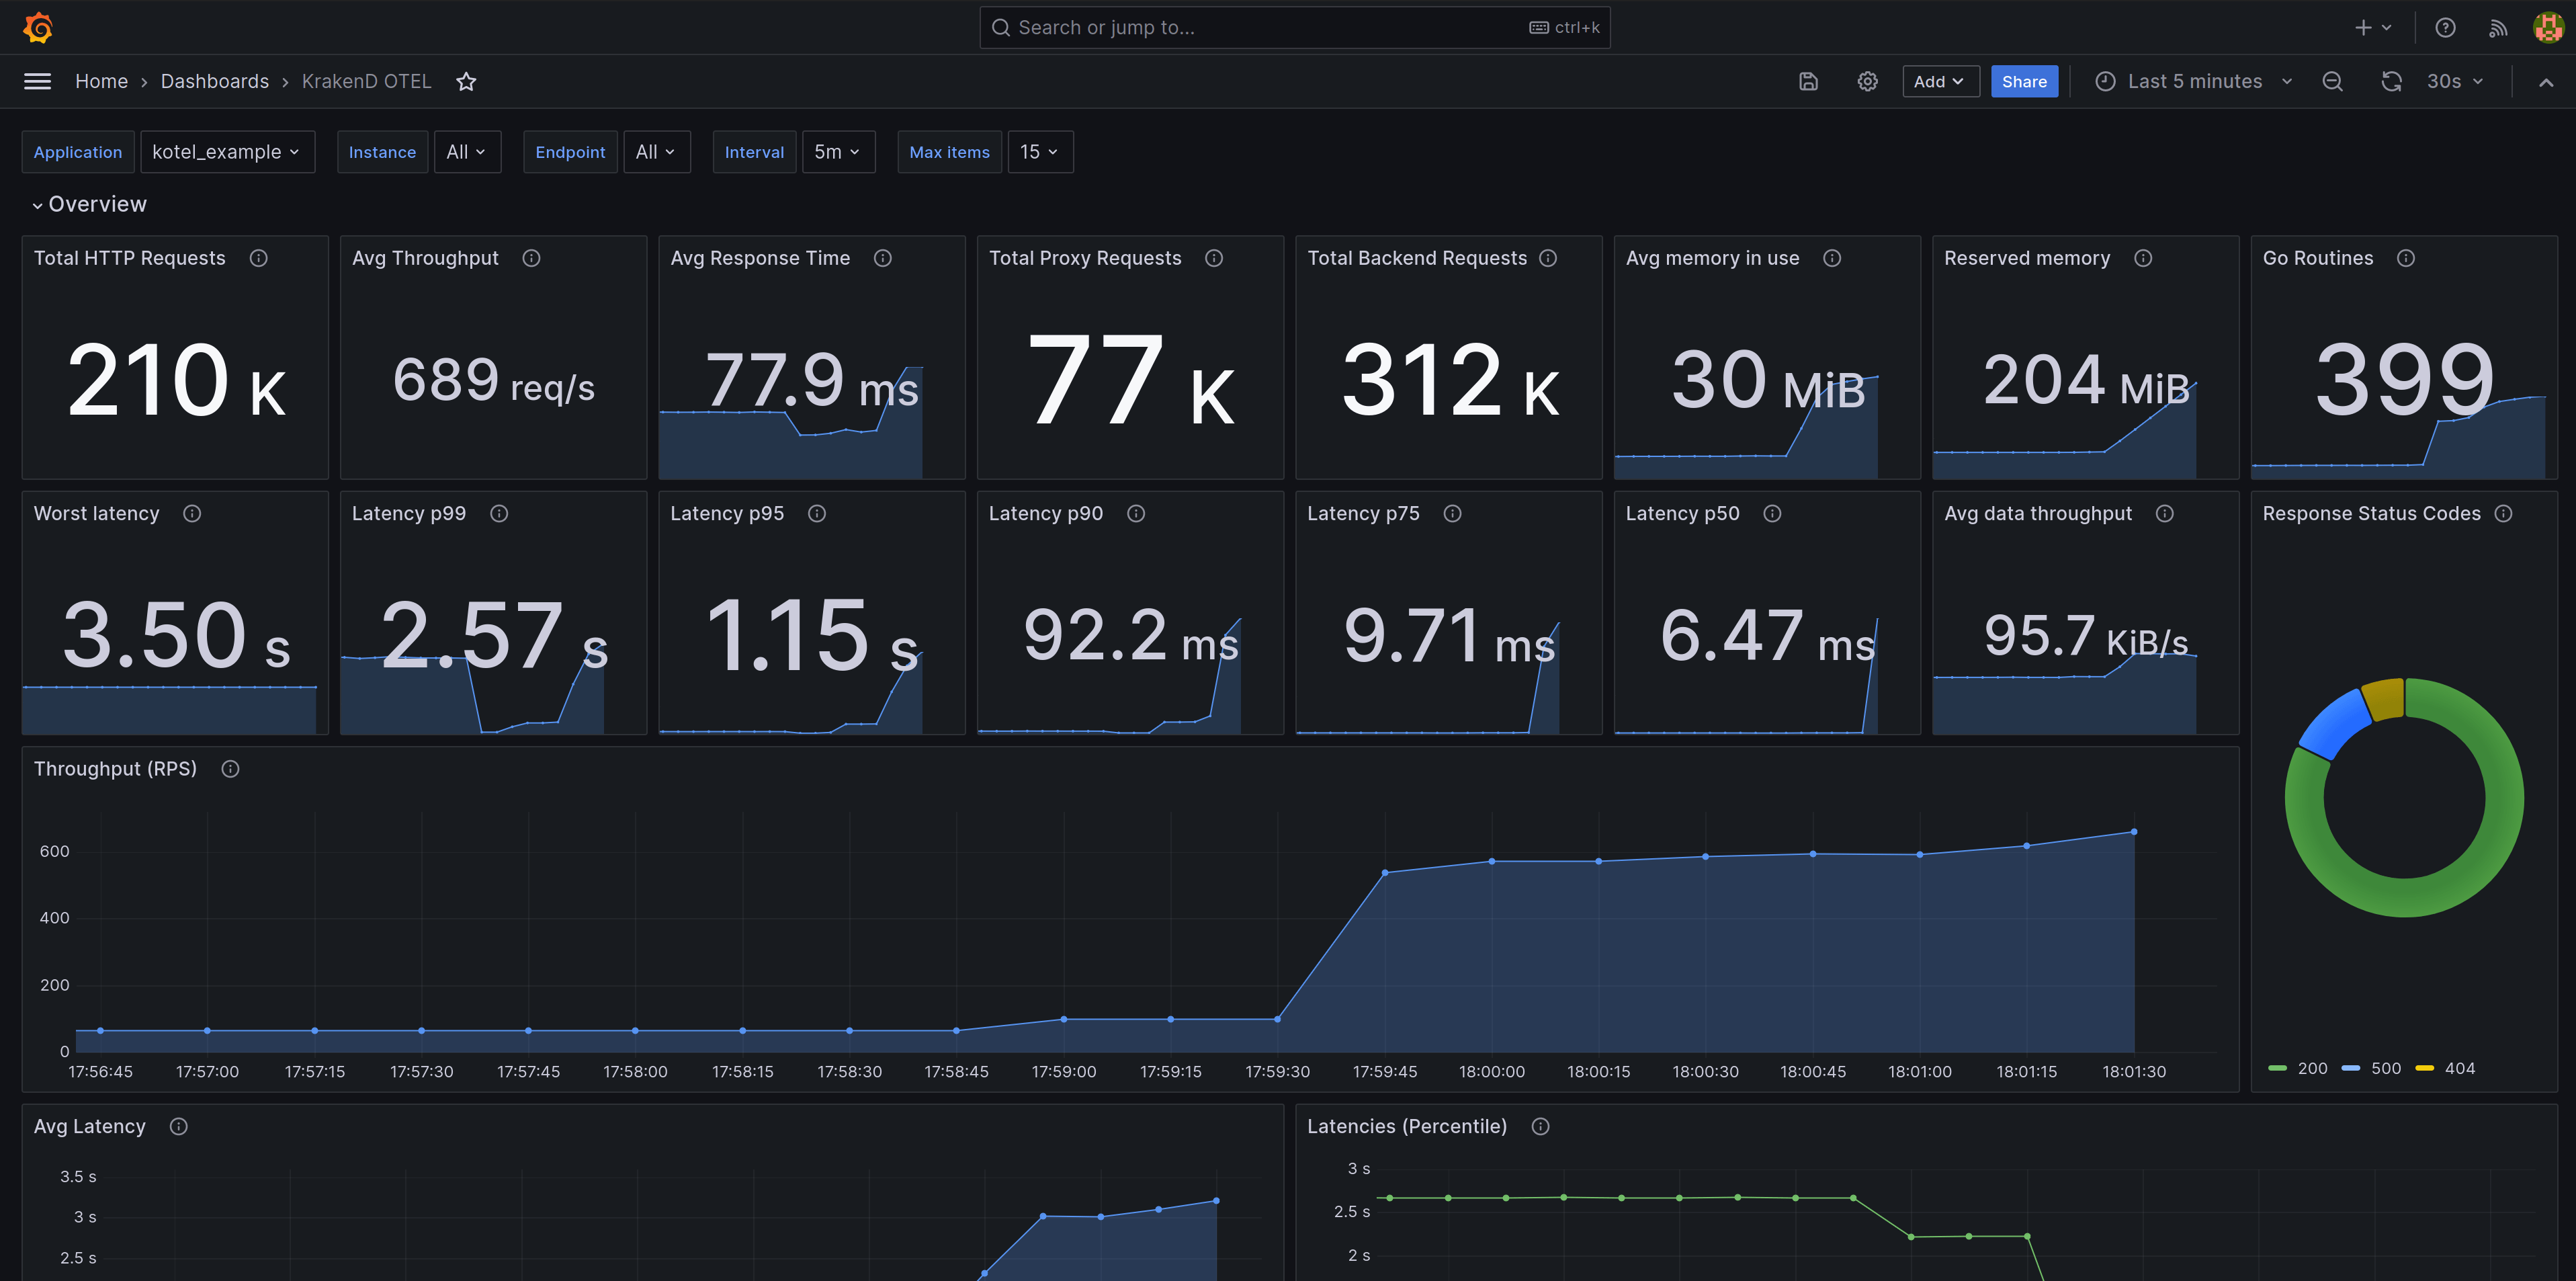
The preconfigured Grafana dashboard for KrakenD offers valuable information to understand the performance of your services and detect anomalies in the service.
The dashboard is extensive and offers you metrics like:
- Requests from users to KrakenD
- Requests from KrakenD to your backends
- Response times
- Memory usage and details
- Endpoints and status codes
- Latencies
- Heatmaps
- Open connections
- Throughput
- Distributions, timers, garbage collection and a long etcetera
The following video makes a quick tour of the information you can find on our Grafana Dashboard using Prometheus as data source:
Importing a Grafana dashboard
The Grafana dashboard has evolved over time, and these are the different versions you can use depending on your KrakenD version and data sources:
| Datasource | Description | Grafana Cloud ID | Source |
|---|---|---|---|
| Prometheus (recommended) | Latest dashboard to display metrics when you add an OpenTelemetry Prometheus exporter. | 20651 | for-prometheus.json |
| Prometheus (Websockets) | Latest dashboard to display WebSocket metrics OpenTelemetry Prometheus exporter. | 22518 | for-prometheus-ws.json |
| Prometheus (Redis) | Latest dashboard to display Redis connection pools. | 22517 | for-prometheus-redis.json |
| InfluxDB v2.x (legacy) | Legacy dashboard for InfluxDB v2 and KrakenD under v2.6. Uses Flux queries | 17074 | for-influxdb-v2.json |
| InfluxDB v1.x (legacy) | Legacy dashboard for InfluxDB v1 and KrakenD under v2.6. Uses InfluxQL queries | 15029 | for-influxdb-v1.json |
You can get all the dashboards on:
To import them, there are several options, being the most common:
- From your Grafana UI (hosted or cloud), click the
+icon in the side menu, and then click Import. Choose import via Grafana.com and use the IDs above. - From the same UI, import the JSON source files instead
- Copy or mount in your Grafana container the dashboards when starting (Volume content here):
volumes:
  - "./grafana/datasources/all.yml:/etc/grafana/provisioning/datasources/all.yml"
  - "./grafana/dashboards/all.yml:/etc/grafana/provisioning/dashboards/all.yml"
  - "./grafana/krakend:/var/lib/grafana/dashboards/krakend"
You can see an example integrated on KrakenD Playground’s Docker compose file.
Getting the metrics on Grafana
Grafana does not require any specific configuration on KrakenD, but it feeds from a data source, so you will need to push data to one of the following:
- Prometheus exporter (recommended)
- Legacy integration for InfluxDb, for older versions of KrakenD
What’s in the dashboard
This new dashboard allows you to load data from a Prometheus data source that scraps data from your KrakenD machines using OpenTelemetry.
The dashboards present a lot of information, allowing you to detect anomalies quickly. The information is separated into different sections.
All sections can be filtered by different criteria, such as the application name, the reporting servers, and the endpoint names. You can also set the intervals of data and the number of items you want to get on lists.
The overview section shows the gateway’s activity. You can see the number of requests, the throughput, load times, and memory consumption.
The latency percentiles will reveal worrying response times, which you can drill down in the following sections.
Knowing how much data the gateway is moving is also essential for networking.
There is low-level detail splitting the proxy and backend phases. In the proxy phase, you can see the endpoint times, including data aggregation from multiple upstream services, and in the backend graphs, you see data happening when KrakenD connects to your services.
The global section contains everything that KrakenD saw in and out. It includes the total timings for a request hitting the service until it is delivered to the client.
It contains the throughput, latencies, data size, fastest and slowest endpoints, status codes, and heat maps.
In the proxy section, you see data after processing the HTTP request and comprehend the internal work of dealing with the endpoint, including spawning multiple requests to the backends, aggregating their results, and manipulating the final response, and you get similar data.
In the Backends section, you can see the activity of single backend requests and responses. It mainly contains the times between KrakenD and your service. It is the richest layer of all.
The application section shows the internals and the Garbage Collector’s operations and performance.
Goroutines are an essential metric in terms of application.
Finally, there is a small section for tracing. You will need a Grafana Tempo data source to view it.
We hope you enjoy our new Grafana dashboard for OpenTelemetry. Do not hesitate to share your thoughts with us!
Contribute to KrakenD Documentation. Improve this page »
