
Azure Monitor Telemetry Integration
Azure Monitor collects, analyzes, and acts on telemetry data from your Azure and on-premises environments. Azure Monitor helps you maximize performance and availability of your applications and proactively identify problems in seconds.
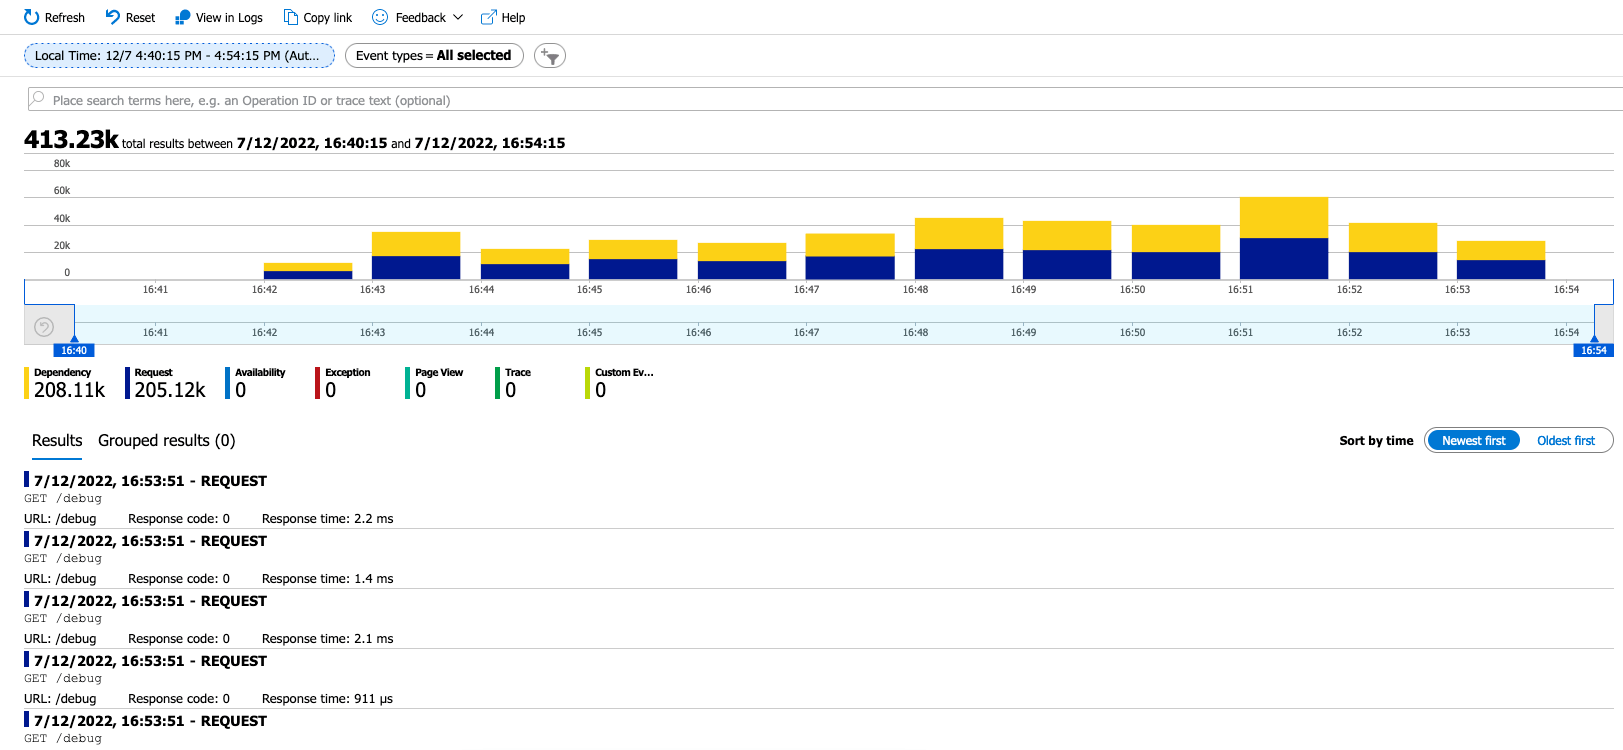
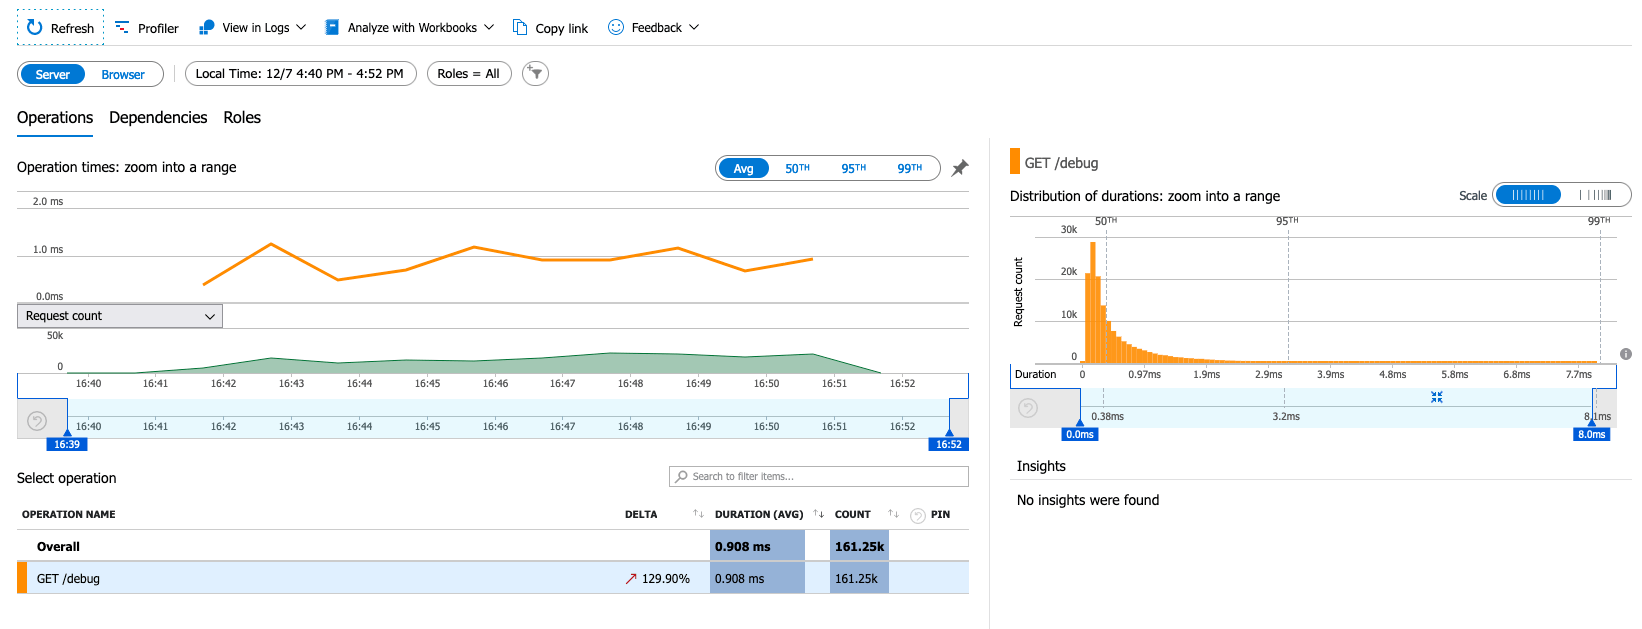
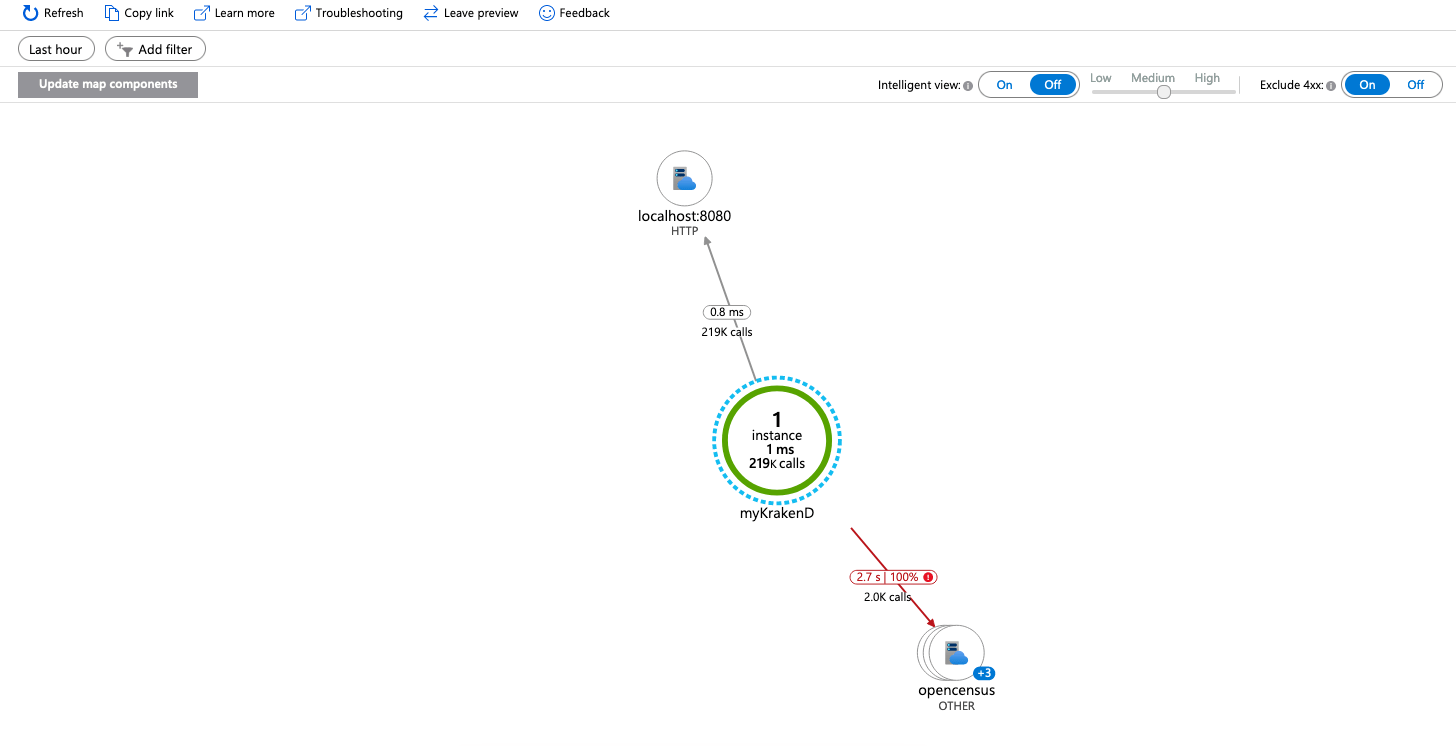
The gateway sends its traces and metrics to a local OpenTelemetry Collector (see repository), allowing the gateway to offload data quickly and the collector can take care of additional handling like retries, batching, encryption or even sensitive data filtering. Finally, the Otel Collector pushes all the data to your Application Insights on Azure Monitor.

Application Insights configuration
The Azure Monitor exporter of the OpenTelemetry Collector sends traces, metrics, and logs to Application Insights. The exporter is flagged as beta for all three signals. KrakenD sends its traces and metrics through it.
There are three things you need to do:
- Create the Application Insights resource on Azure
- Start the OpenTelemetry Collector
- Add it to KrakenD’s configuration
Create an Application Insights resource
To enable the Azure Monitor integration, you need to add a new resource Application Insights, under your Azure account and fill in the information as required (the details provided during the registration form are not relevant to the configuration).
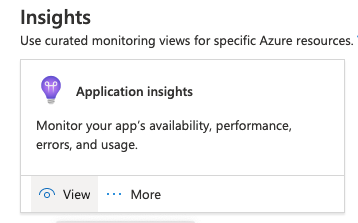
When the resource finishes creating, save the Instrumentation Key or Connection String for later usage.
Starting the OpenTelemetry Collector
You can start the OpenTelemetry Collector with Azure’s compatibility using its Docker image. Here there is a docker-compose.yml example that includes a KrakenD and a collector:
services:
  krakend:
    image: krakend:3.0.4
    command: [ "krakend", "run", "-d", "-c", "/etc/krakend/krakend.json"]
    volumes:
      - ./:/etc/krakend
    ports:
      - 8080:8080
  # Collector
  otel-collector:
    image: otel/opentelemetry-collector-contrib
    command: ["--config=/etc/otel-collector.yaml"]
    volumes:
      - ./otel-collector.yaml:/etc/otel-collector.yaml
    ports:
      - "4317"
      - "4318"
The configuration mounted for the collector is below, otel-collector.yaml:
receivers:
  otlp:
    protocols:
      grpc:
        endpoint: "0.0.0.0:4317"
      http:
        endpoint: "0.0.0.0:4318"

exporters:
  # debug:
  #   verbosity: detailed
  azure_monitor:
    connection_string: "InstrumentationKey=XXXXXXX;IngestionEndpoint=XXXXXXX"

service:
  telemetry:
    logs:
      level: "warn"
  pipelines:
    traces:
      receivers: [otlp]
      exporters: [azure_monitor]
    metrics:
      receivers: [otlp]
      exporters: [azure_monitor]
Enable the debug exporter only if you find problems and want extra information, and add it to the exporters list of the pipeline you want to inspect.
Replace the value of the connection_string entry with the one you got in your Azure dashboard.
KrakenD exports metrics by default, so keep the metrics pipeline: when the collector has none, KrakenD logs a failed to upload metrics error on every reporting period. If you only want traces in Azure, remove the metrics pipeline and set "disable_metrics": true in the KrakenD exporter.
azure_monitor since August 2026. Collectors released before the rename only know it as azuremonitor, and newer collectors still accept that name with a deprecation warning. If your collector rejects azure_monitor, use azuremonitor in both the exporters section and the pipelines.Configuration for KrakenD
Lastly, add at the service level of KrakenD the following configuration:
{
  "version": 4,
  "extra_config": {
    "telemetry/opentelemetry": {
      "trace_sample_rate": 1,
      "exporters": {
        "otlp": [
          {
            "name": "azure_monitor",
            "host": "otel-collector",
            "port": 4317
          }
        ]
      }
    }
  }
}
The configuration above reports a 100% of the activity (trace_sample_rate = 1), when in production consider lowering this value (e.g., 0.1) as you will want a sample of the traffic only.
The otel-collector above is the name of the docker compose service running the collector. You might need to replace it if you are not using this example.
With these three steps, KrakenD starts sending data to Azure Monitor. You should start seeing the graphs populated on Azure Monitor in a couple of minutes.
Other Resources
- OpenTelemetry Collector Docker Image with Azure support.
- Application Insights
- OpenTelemetry Collector
Contribute to KrakenD Documentation. Improve this page »