Document updated on May 11, 2023
New Relic Telemetry Integration
The New Relic integration lets you push KrakenD metrics and distributed traces to your New Relic dashboard. It uses internally the official New Relic SDK and brings its features to your APM dashboard.
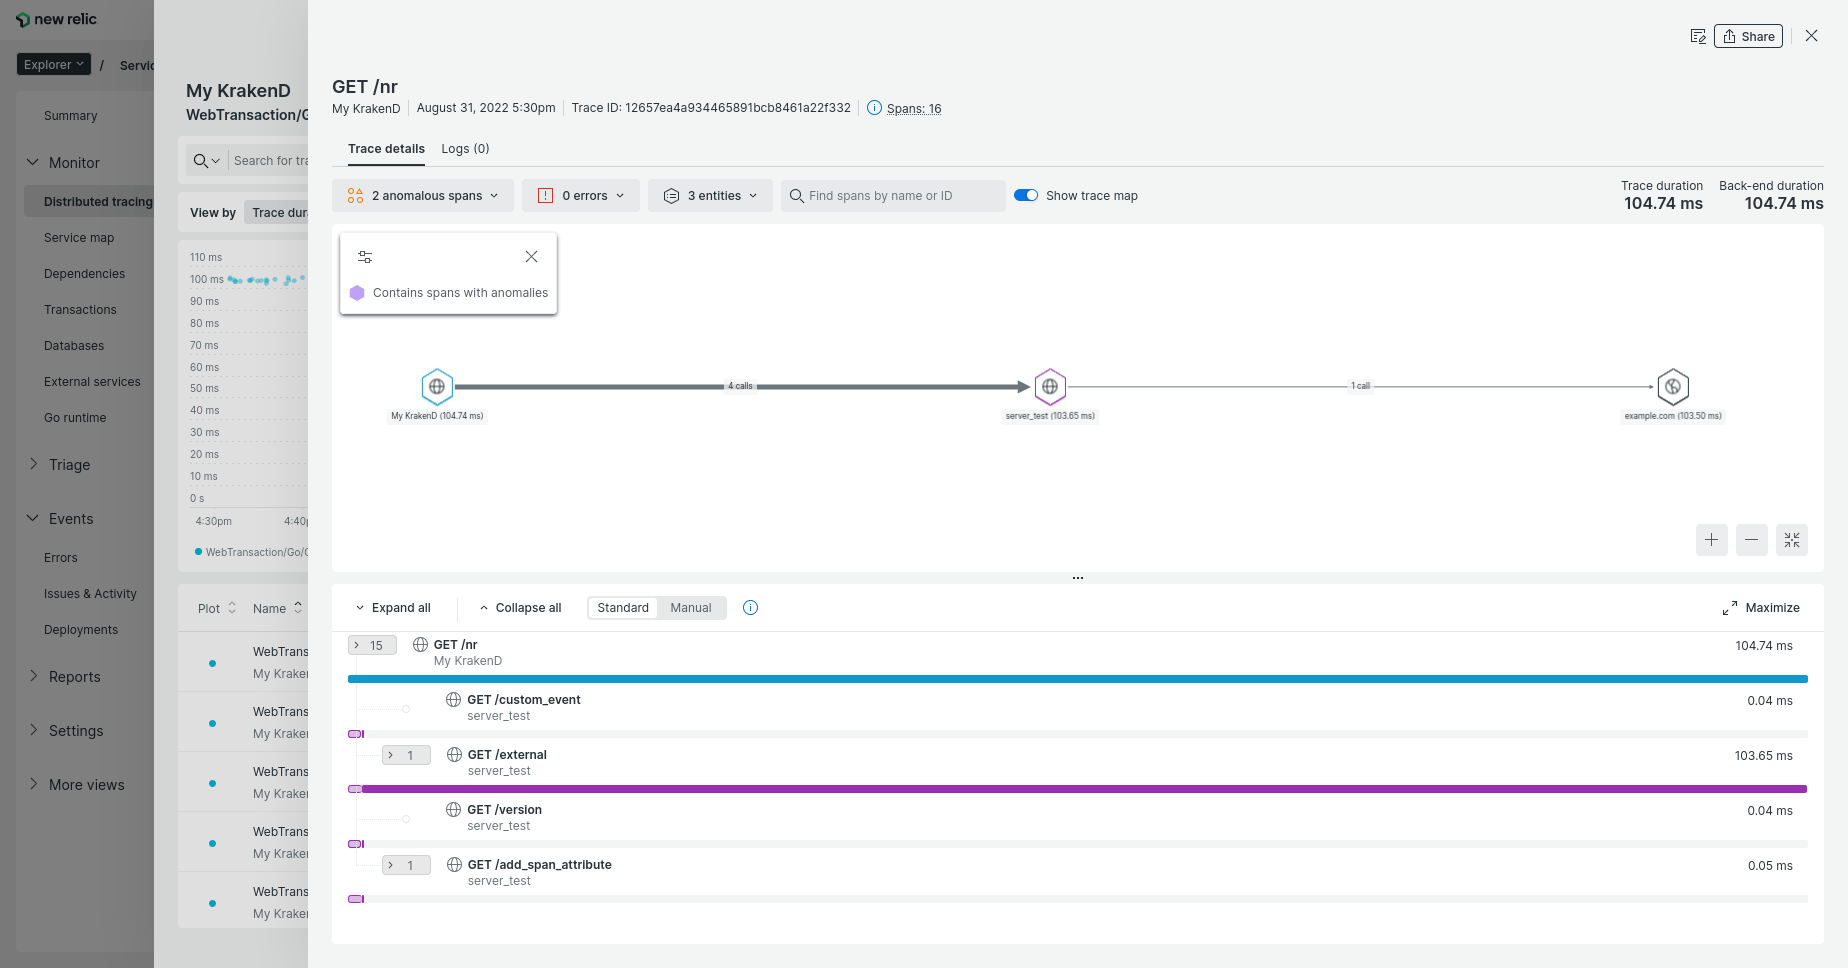
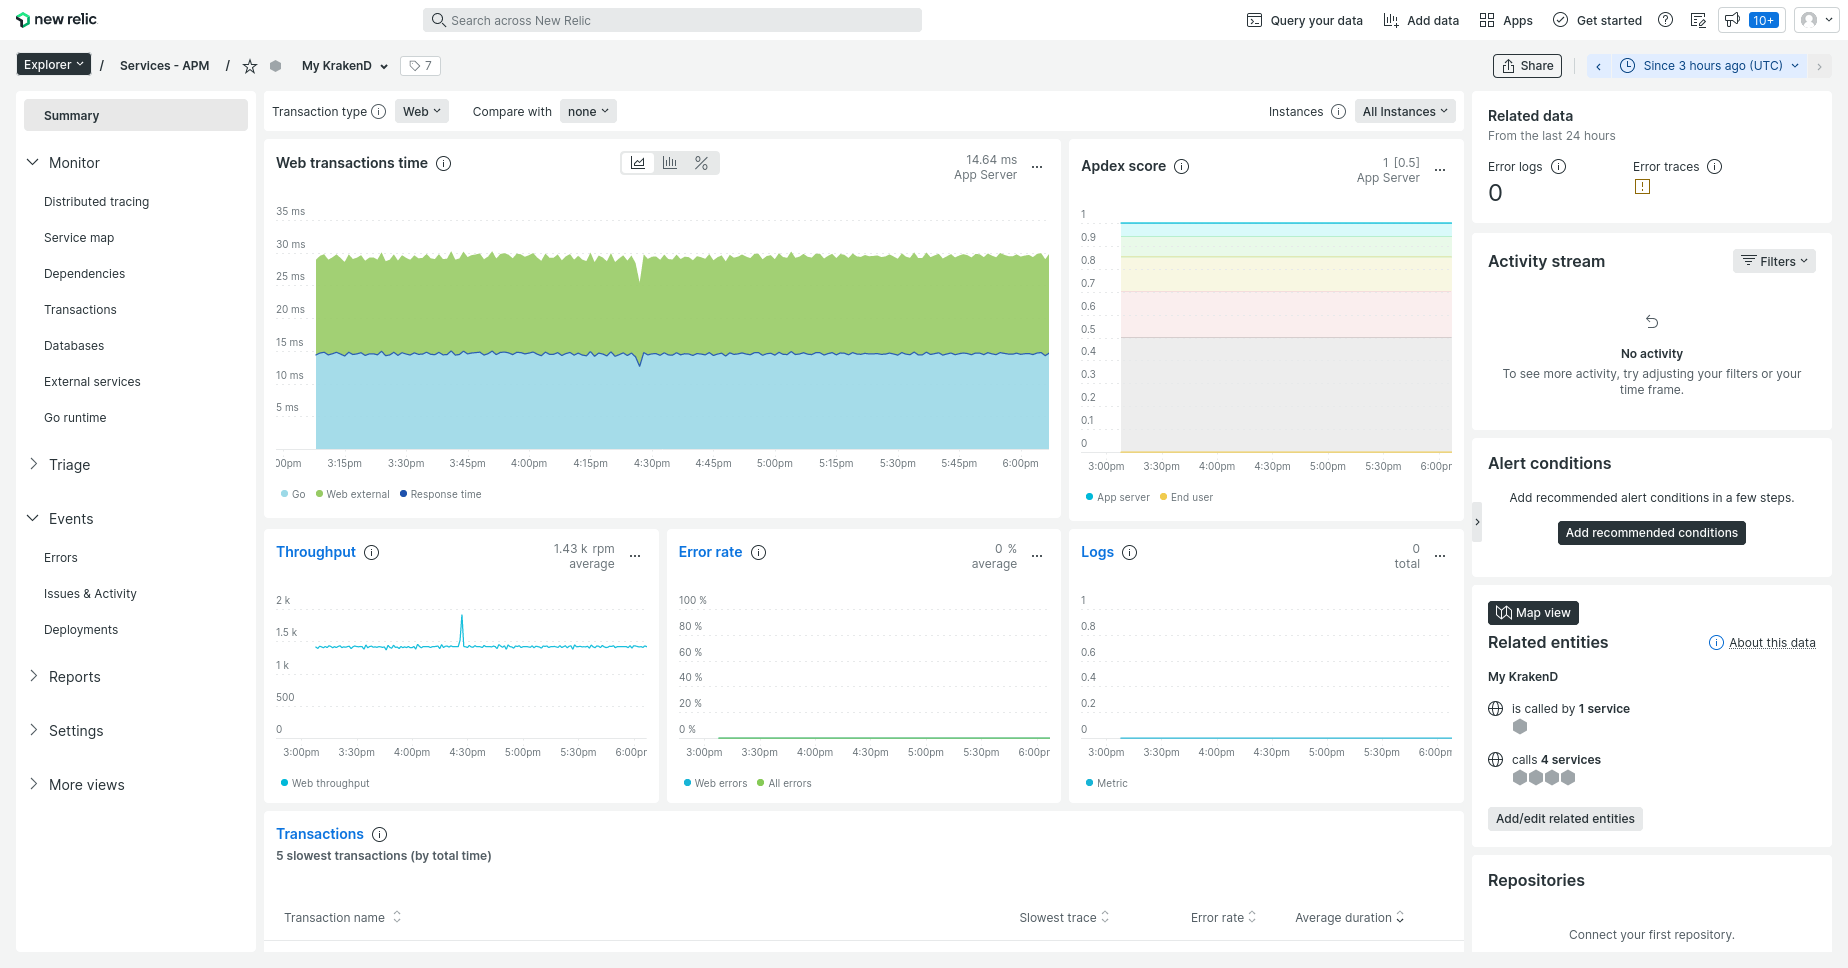
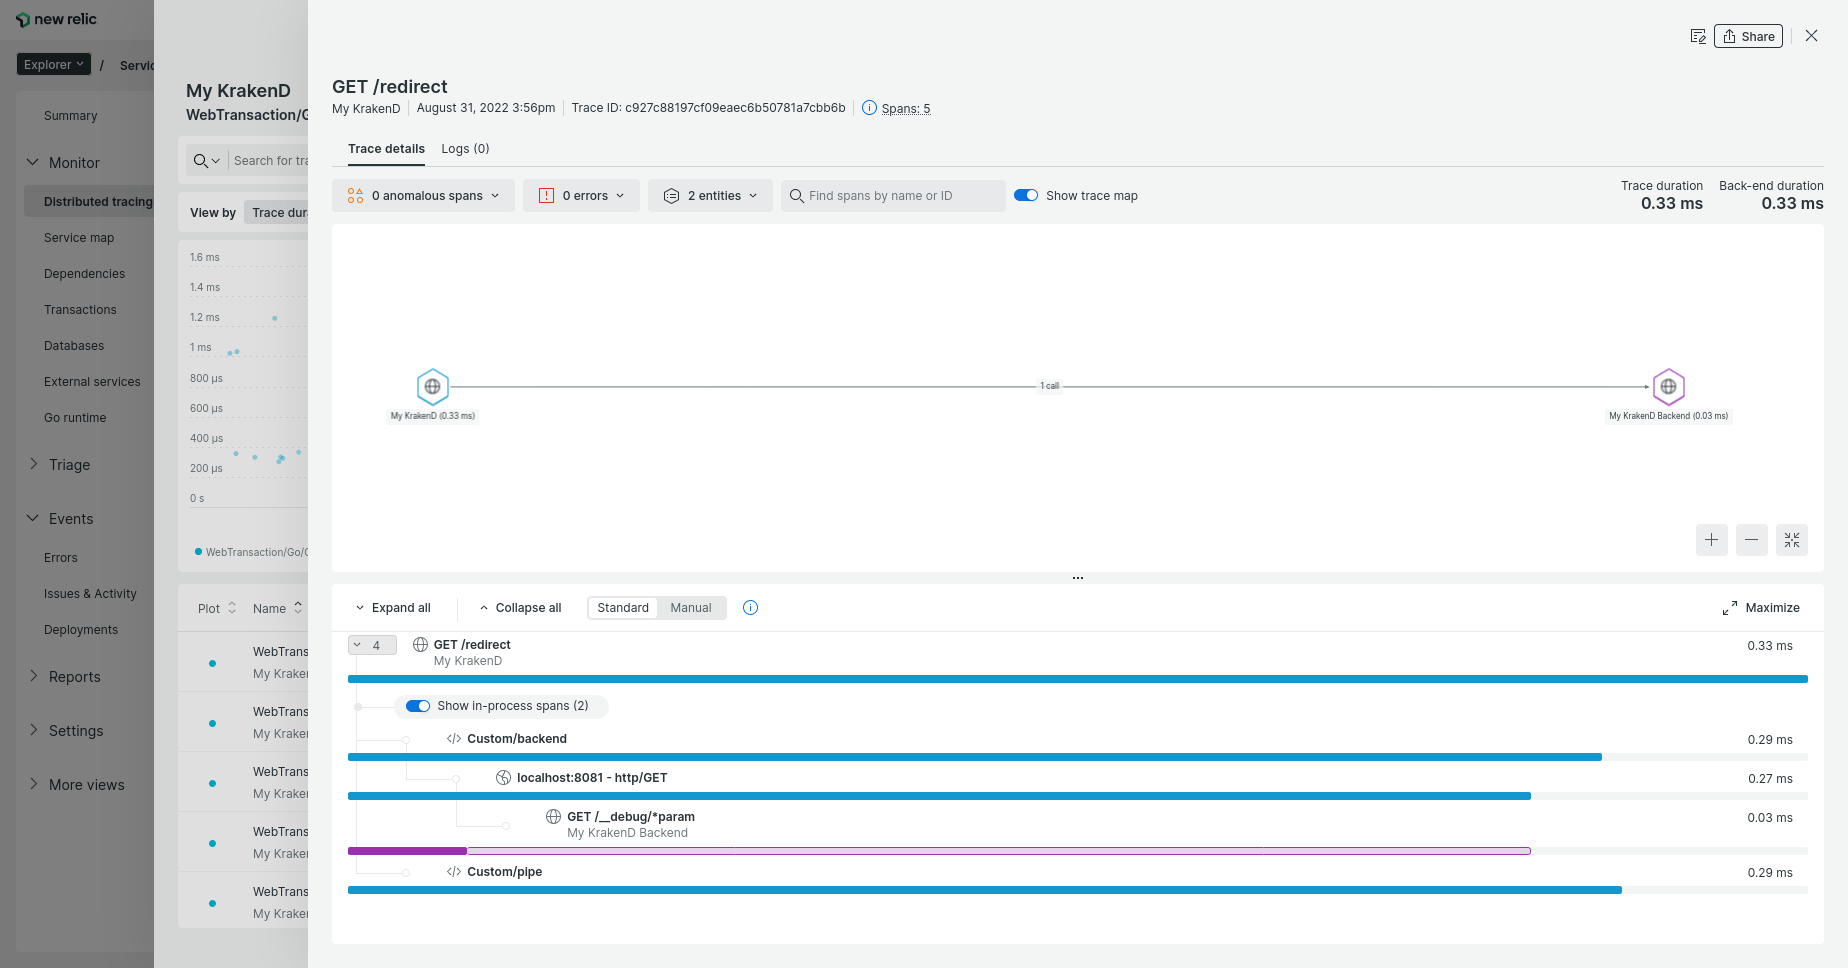
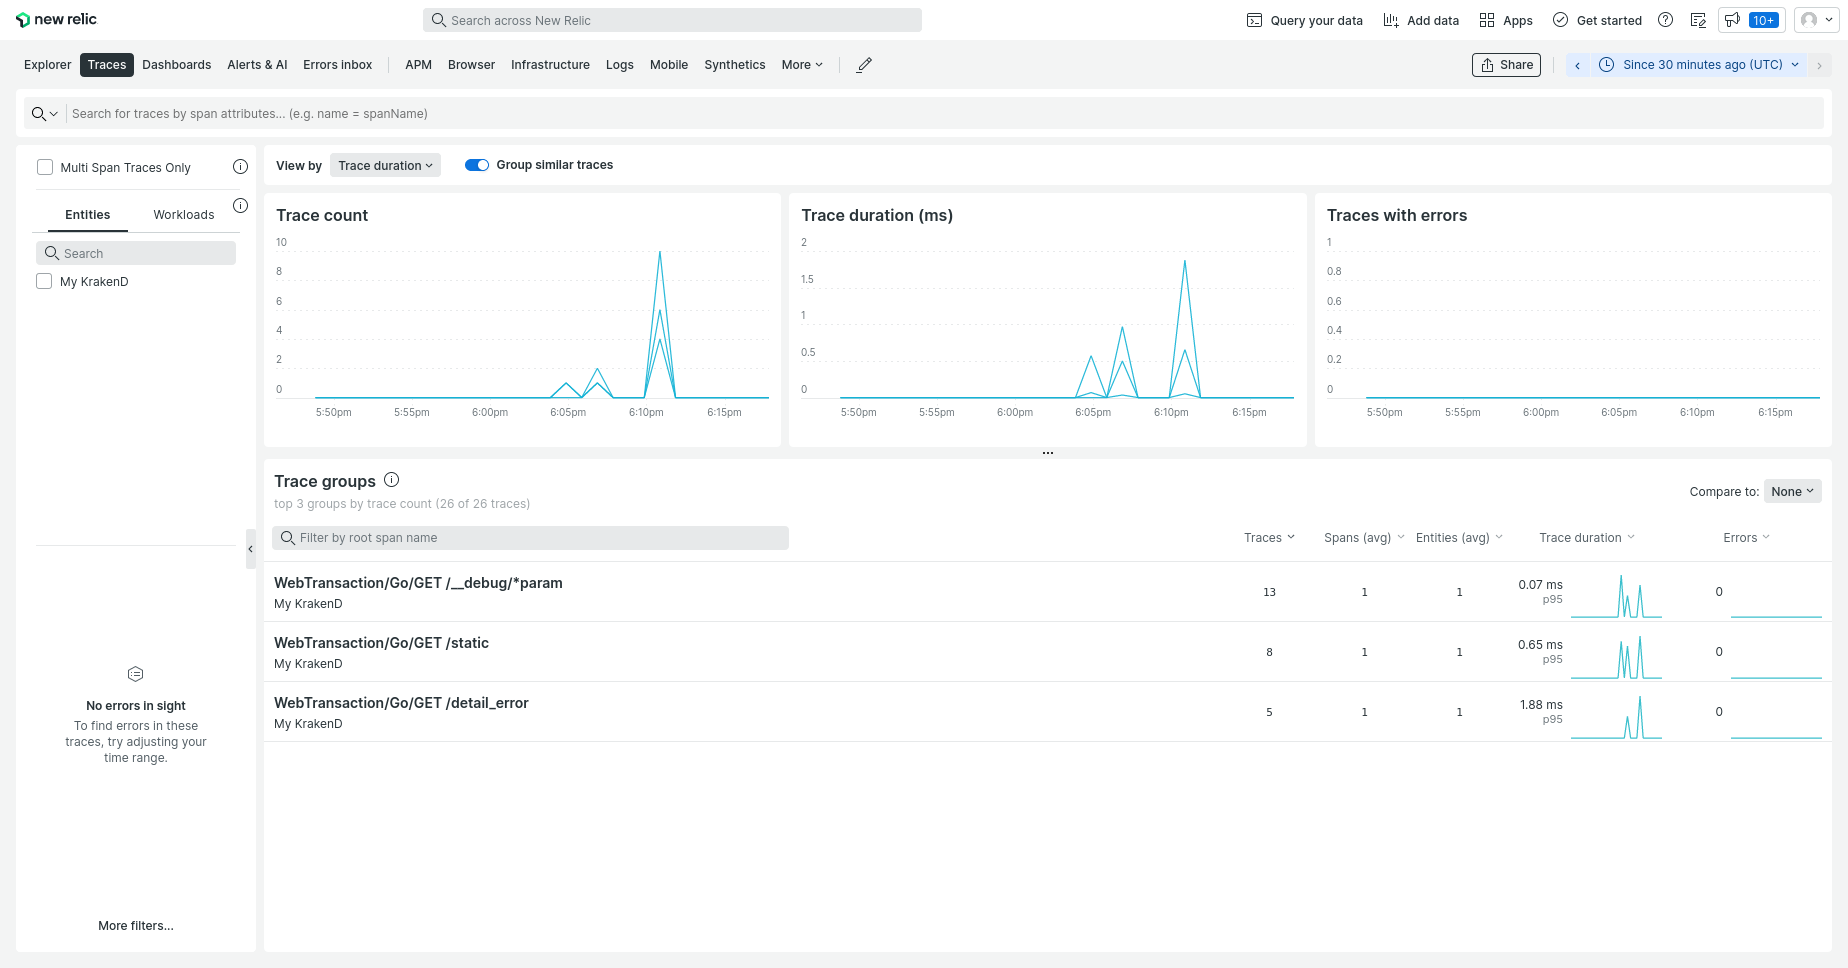
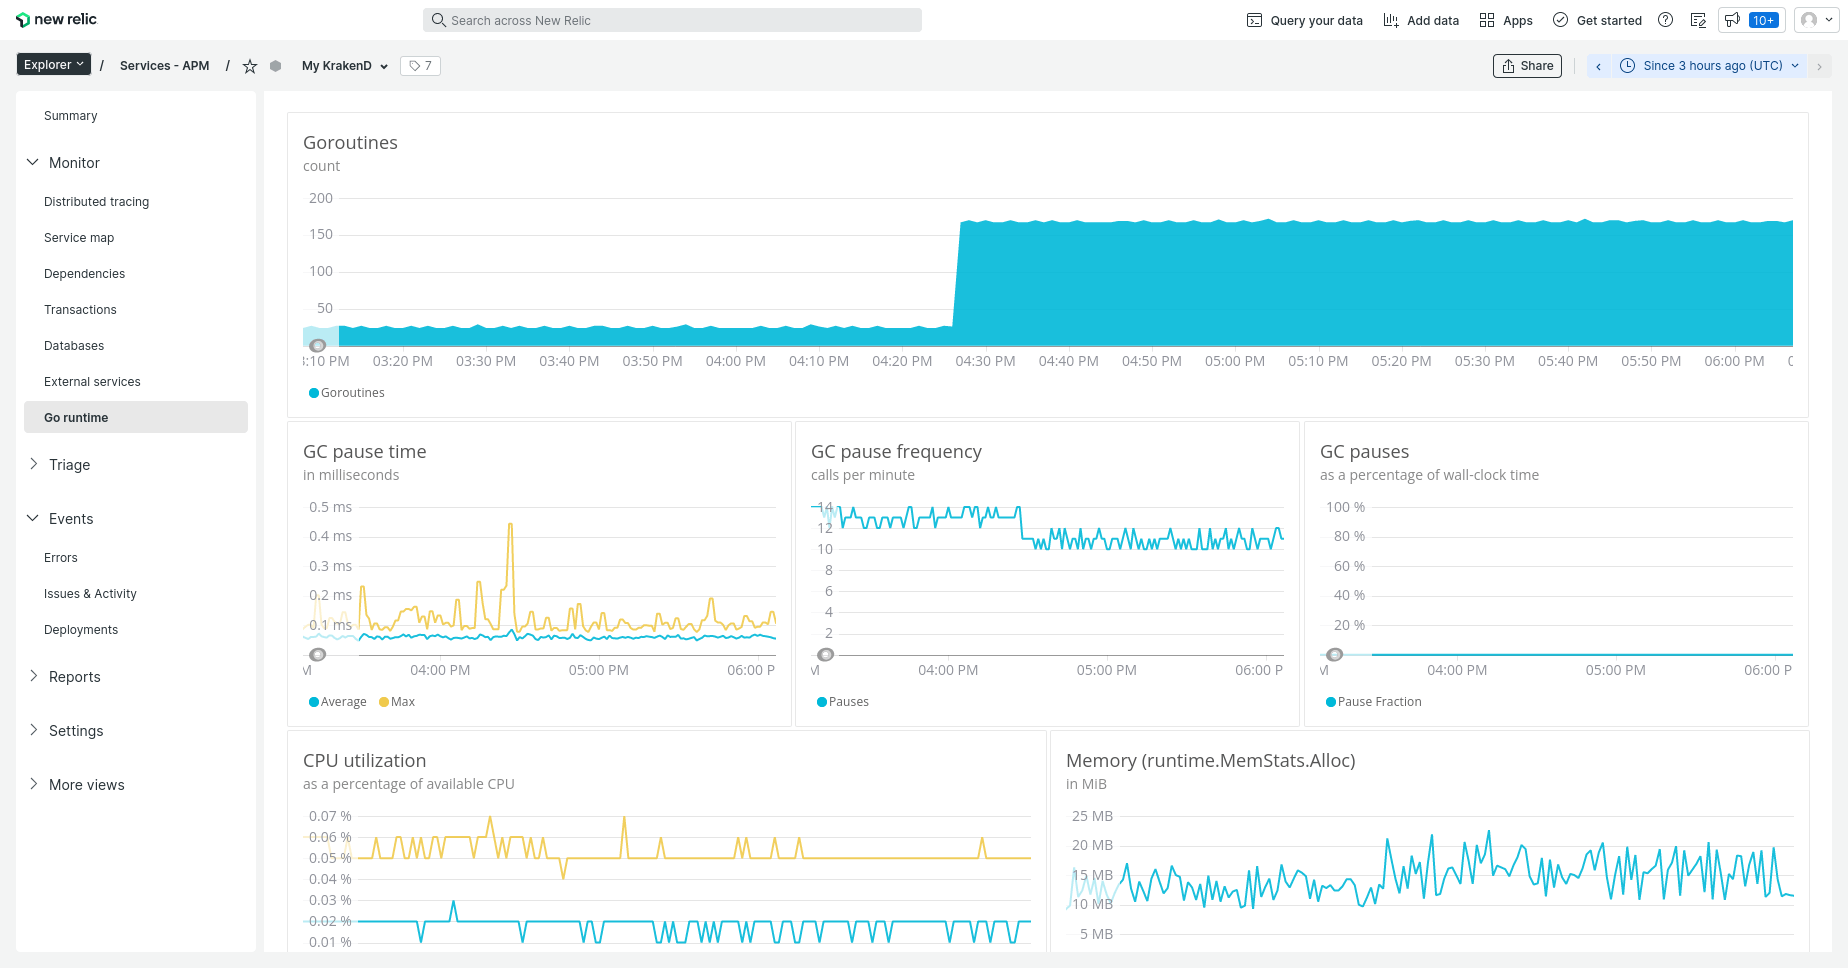
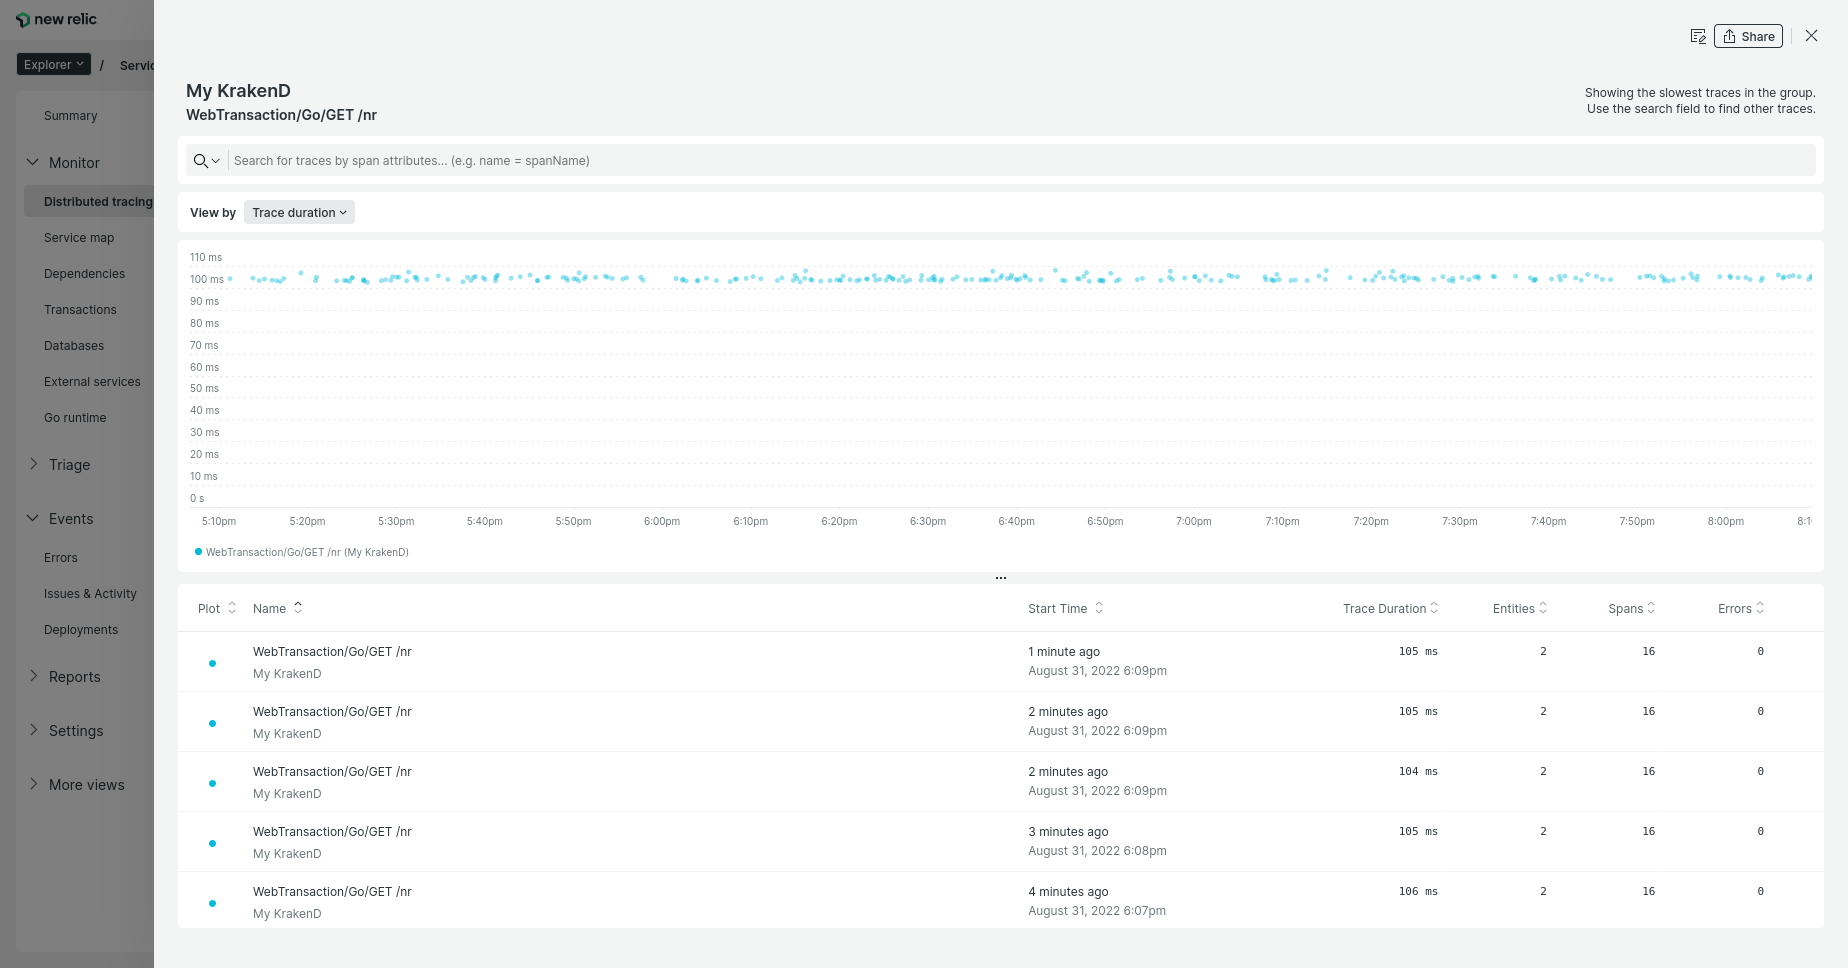
Examples of the data you can see on New Relic:
New Relic configuration
To add KrakenD telemetry reporting to New Relic, you only need add the following configuration with your API Key:
{
    "version": 3,
    "name": "My KrakenD API gateway",
    "extra_config": {
        "telemetry/newrelic": {
            "license": "XXXX",
            "debug": true
        }
    }
}
Fields of NewRelic exporter
debugboolean- Set to true when configuring New Relic for the first time while in development, to see the activity in the logs. Set to false in production.Defaults to
false headers_to_passarray- Defines an explicit list of headers sent during the client request that will be reported to NewRelic, in addition to the default headers NewRelic sets. Setting the
["*"]value will send all headers sent by the client to NewRelic. Whether you declare this setting or not, you will usually receive from the NewRelic SDK theAccept,Content-Type,User-Agent, andRefererheaders.Example:["*"] license* string- The API key provided by New Relic to push data into your account.
This is all the configuration you need for New Relic. The service name in the New Relic dashboard will match the name attribute in the root of your KrakenD configuration.
Upgrading from previous New Relic component
telemetry/opencensus is deprecated and will be removed on the next release. Please replace it with the configuration above.If you are still using the previous component you will see this WARNING in the logs:
Log
$DEPRECATION NOTICE: The New Relic component based on telemetry/opencensus is deprecated and will be removed on the next version. Please update your configuration to use the upgraded component telemetry/newrelicTroubleshooting
If you don’t see reports in your New Relic account after sending activity to KrakenD, enable the debug flag locally to see what is going on. The logs will show information to help you understand what is going on.
The logger should be configured with a DEBUG level to see these messages.
Typical problems might be:
- Your API Key is not properly set
- Your API Key is of the wrong type
- You are pushing data to the wrong endpoint (you’ll see
403errors in the debug). You might be using an account from the EU, but the endpoint is from US or similar.
Getting your API Key from New Relic
To set the license attribute on KrakenD you need to:
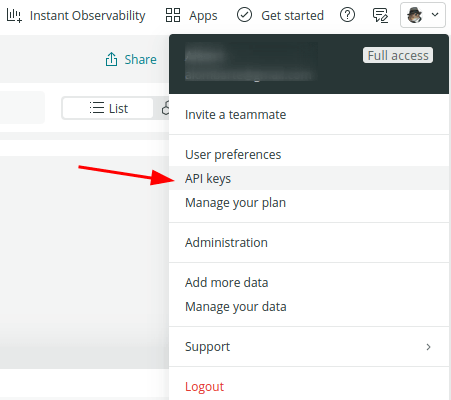
- Go to your account, and select API keys
- In the API keys screen, select Create a key
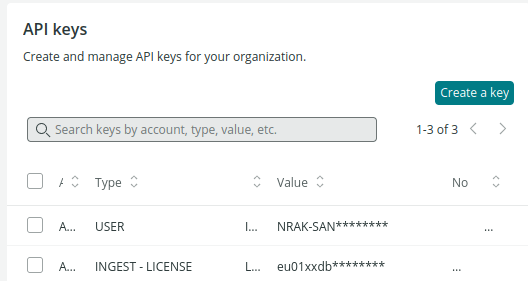
- Select the Key type
Ingest - Licensefrom the dropdown and create the key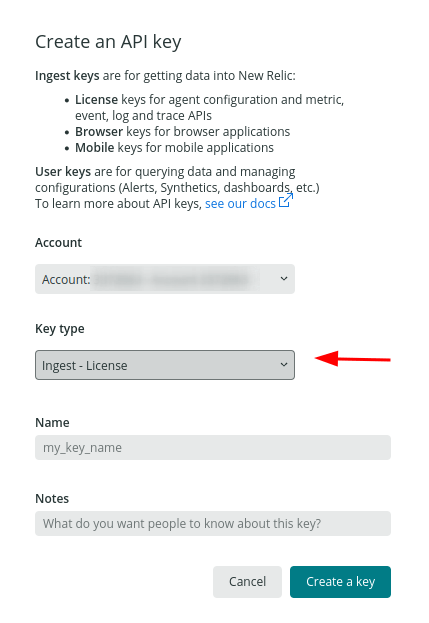
- Copy the resulting API key into the configuration.
The screenshots and options above might change as a result of New Relic continuous improvement of their interfaces.
