Document updated on Sep 21, 2022
ELK Stack dashboard

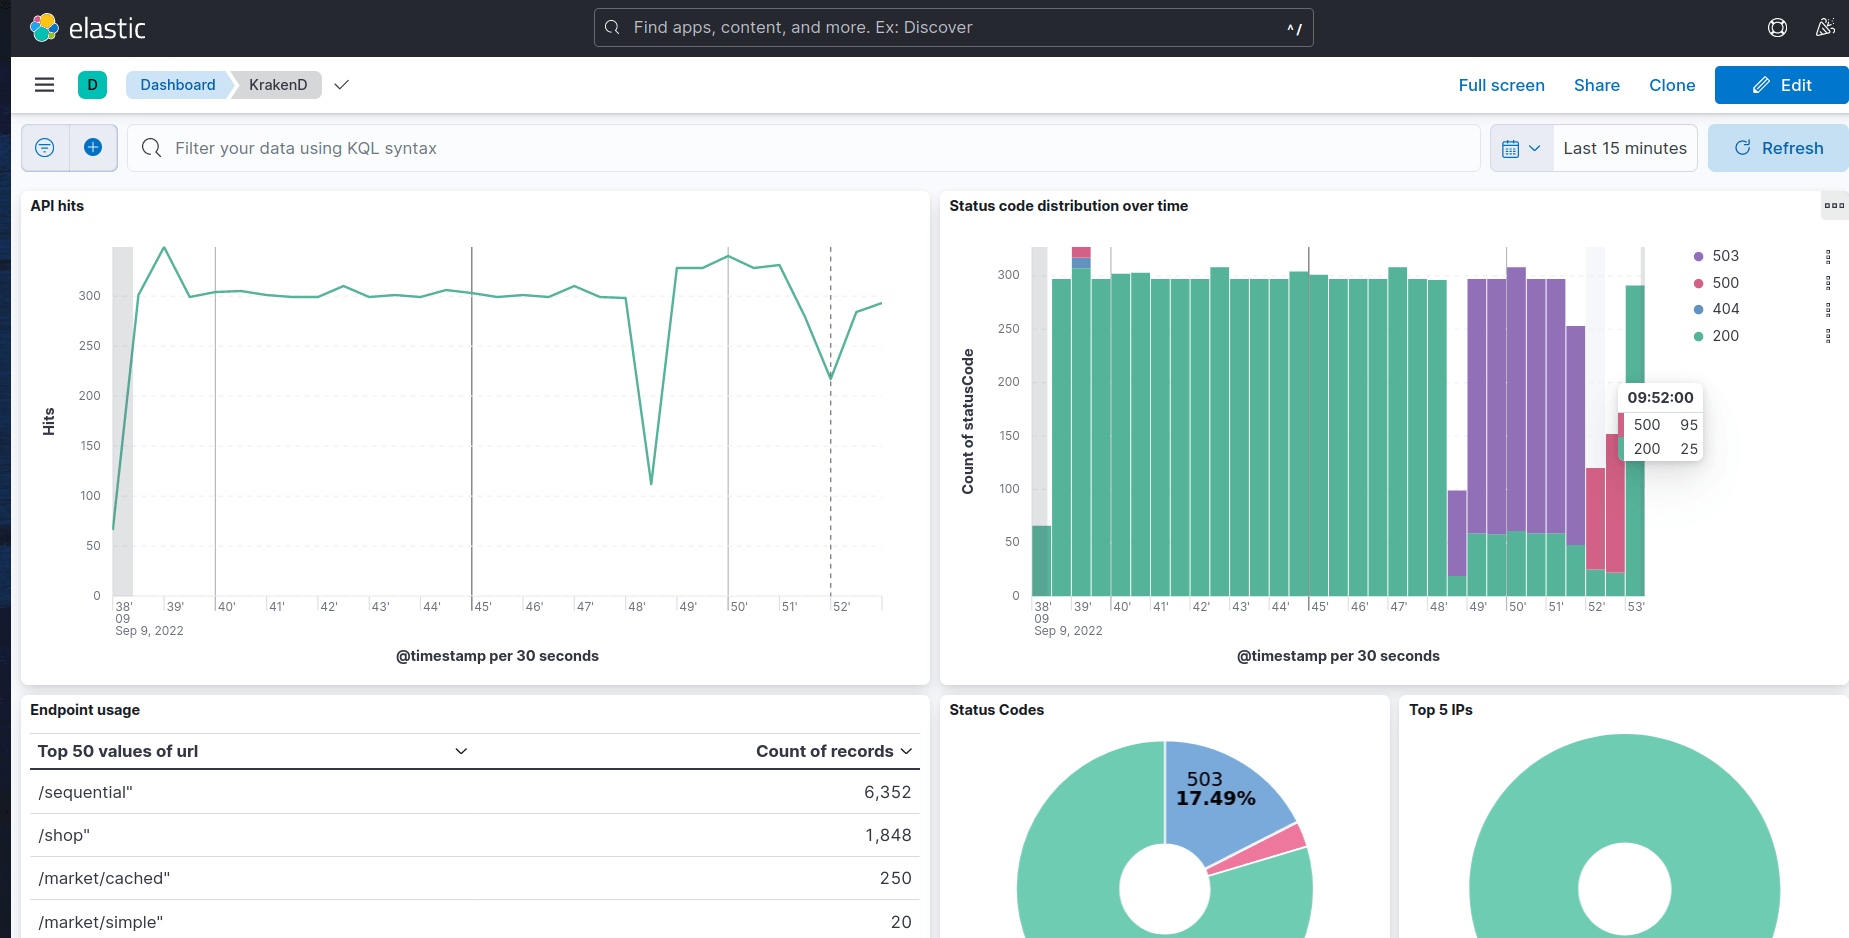
KrakenD can push logs to external services; a good example is an integration with the ELK Stack (Elastic + Logstash + Kibana). The ELK integration allows you to have KrakenD pushing logs to your Elastic server and visualize them through a Kibana dashboard.
The Kibana dashboard lets you monitor the logging activity of the gateway and identify problems quickly. The included dashboard is a starting point that provides typical graphs and metrics, but you can extend it as per your needs and add other metrics to watch.
ELK Configuration
The configuration you need on your krakend.json to enable ELK integration is:
{
  "$schema": "https://www.krakend.io/schema/v2.2/krakend.json",
  "version": 3,
  "extra_config": {
    "telemetry/logging": {
      "level": "DEBUG",
      "@comment": "Prefix should always be inside [] to keep the grok expression working",
      "prefix": "[KRAKEND]",
      "syslog": false,
      "stdout": true
    },
    "telemetry/gelf": {
      "address": "logstash:12201",
      "enable_tcp": false
    }
  }
}
There’s nothing else on KrakenD that you need to do.
stdout as KrakenD pushes them to the ELK stack.Logstash and Kibana configuration
The configuration files you need for Logstash and Kibana can be downloaded from the Telemetry Dashboards repository.
Logstash
The logstash.conf file includes an example of a Logstash configuration. First, change the hostname of your Elasticsearch server and any custom ports you might use. Then, start Logstash with this configuration to properly ingest KrakenD logs.
Kibana
To import the Kibana dashboard included in the ELK repository above, execute the following command once your Kibana is up and running. Replace localhost:5601 if needed:
Term
$curl -X POST "localhost:5601/api/saved_objects/_import" -H "kbn-xsrf: true" --form [email protected] -H "kbn-xsrf: true"
ELK live demo
If you want to see how this works, you can start the KrakenD Playground.
