Document updated on Oct 26, 2021
Google Analytics
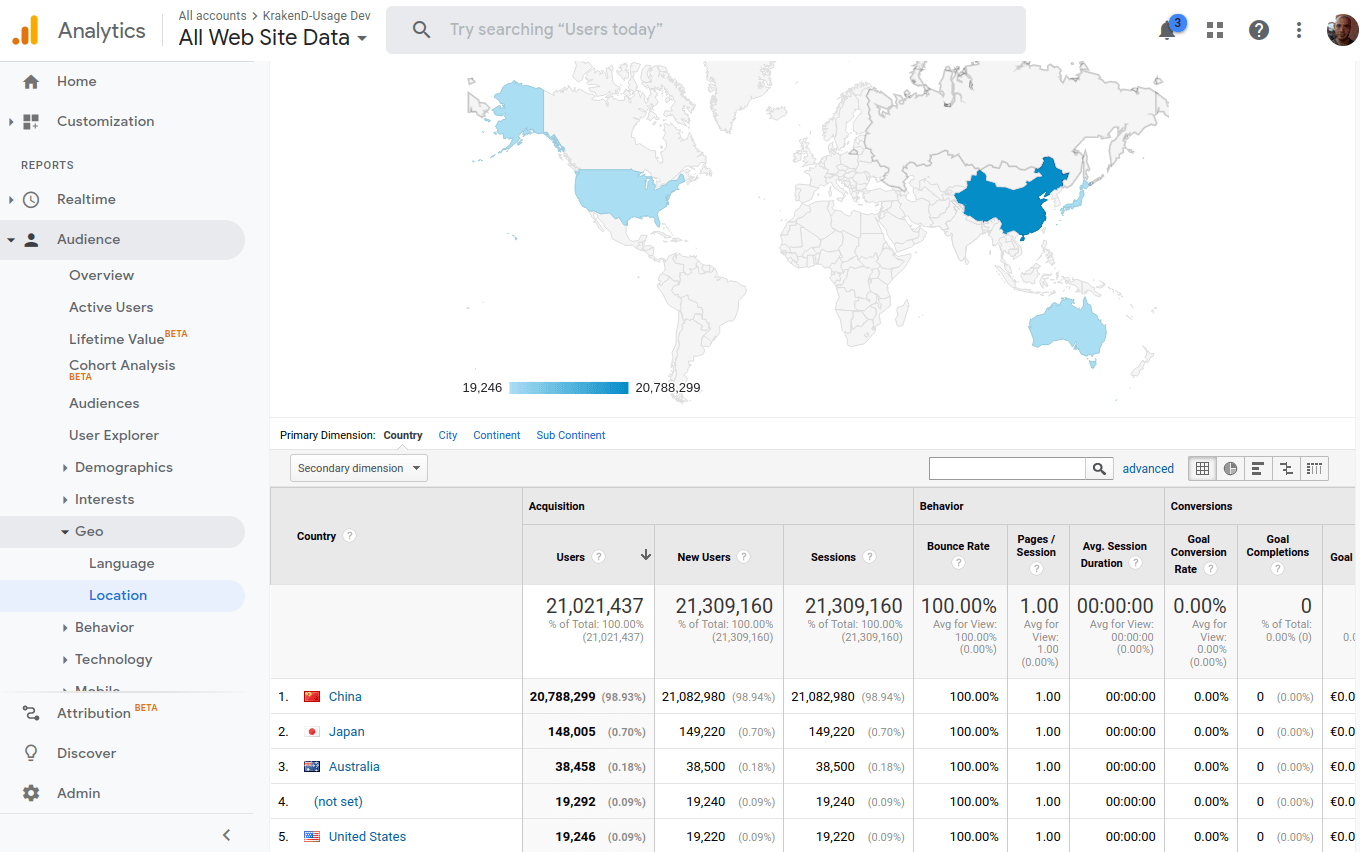
Google Analytics provides a reliable platform to measure the ROI of your API and track its usage. In addition, the KrakenD GAnalytics integration allows you to generate API Analytics from your API activity, using Google’s Analytics platform as the storage backend. The same platform and tools you are using today to track web pages can help you track your API.
This component records the API activity and reports it efficiently and asynchronously in batches to Google Analytics. The reporting phase does not interfere with the serving of requests, keeping the gateway efficient.
How does it work?
When API users request content to KrakenD, the gateway processes it as usual and marks it internally for reporting. Then, an internal consumer of KrakenD, asynchronous and independent from the request workflow, prepares batches with aggregated requests and sends the reports to Google Analytics as pageviews, including additional metadata like the Client IP, Client ID, User-Agent, etc. The list of fields that Analytics receives is:
Referer: The value extracted from the Referer or Origin headers in the original requestHost: The host that originated the request to KrakenDPath(endpoint): The consumed endpointTags: All additional tags you have set in the configuration if any.Client IP: The requester’s IP addressClient ID: A unique UUID generated for the client.User ID: The User ID is a calculated field trying to get a hashed value out of the IP and User Agent making the request.
KrakenD reports to Analytics all traffic, including pings to /__health or /__debug endpoints.
Analytics configuration
To enable the API analytics backed on Google, add in the root of your configuration the following extra_config and options:
{
  "version": 3,
  "extra_config": {
      "telemetry/ganalytics" : {
        "track_id":    "UA-12345678-9",
        "url":         "https://www.google-analytics.com/batch",
        "buffer_size": 1000,
        "workers":     100,
        "tags": {
          "cd1": "my custom dimension"
        },
        "timeout": "250ms"
      }
    }
}
The mandatory options of the telemetry/ganalytics are:
Fields of telemetry/ganalytics
buffer_sizeinteger- The size of the buffer determines how much data can be stored in memory. The default value is twice the number of workers. It must be at least twice the number of workers, otherwise it is automatically changed to the double.
tagsobject- An object with key-values describing the tags you want to include when sending reports and their values. These tags are static.
timeoutstring- The time you will wait for the internal buffer to be avaiable before discarding a report.Specify units using
ns(nanoseconds),usorµs(microseconds),ms(milliseconds),s(seconds),m(minutes), orh(hours).Defaults to"100ms" track_id* string- The tracking ID as provided by Google. It is recommended to create a new property in Google Analytics to track the activity. It usually looks like UA-1234567.Example:
"UA-1234567" url* string- The reporting URL where KrakenD sends the batches. Unless you need a custom backend endpoint, use
https://www.google-analytics.com/batch. workersinteger- The number of internal workers that send the reports in batch.Defaults to
2
Troubleshooting
General errors:
All the logs display the reporting activity under the prefix [SERVICE: GA]. If there are problems while sending or processing the data, you’ll see the message in the logs with the prefix above.
Connectivity issues:
If there is a latency between your server and the analytics endpoint, you might see timeouts in the logs for whatever reason. Keep in mind that in an eventual case of network problems, the longer the timeout is, the more memory you will need to store the pending-to-send reports.
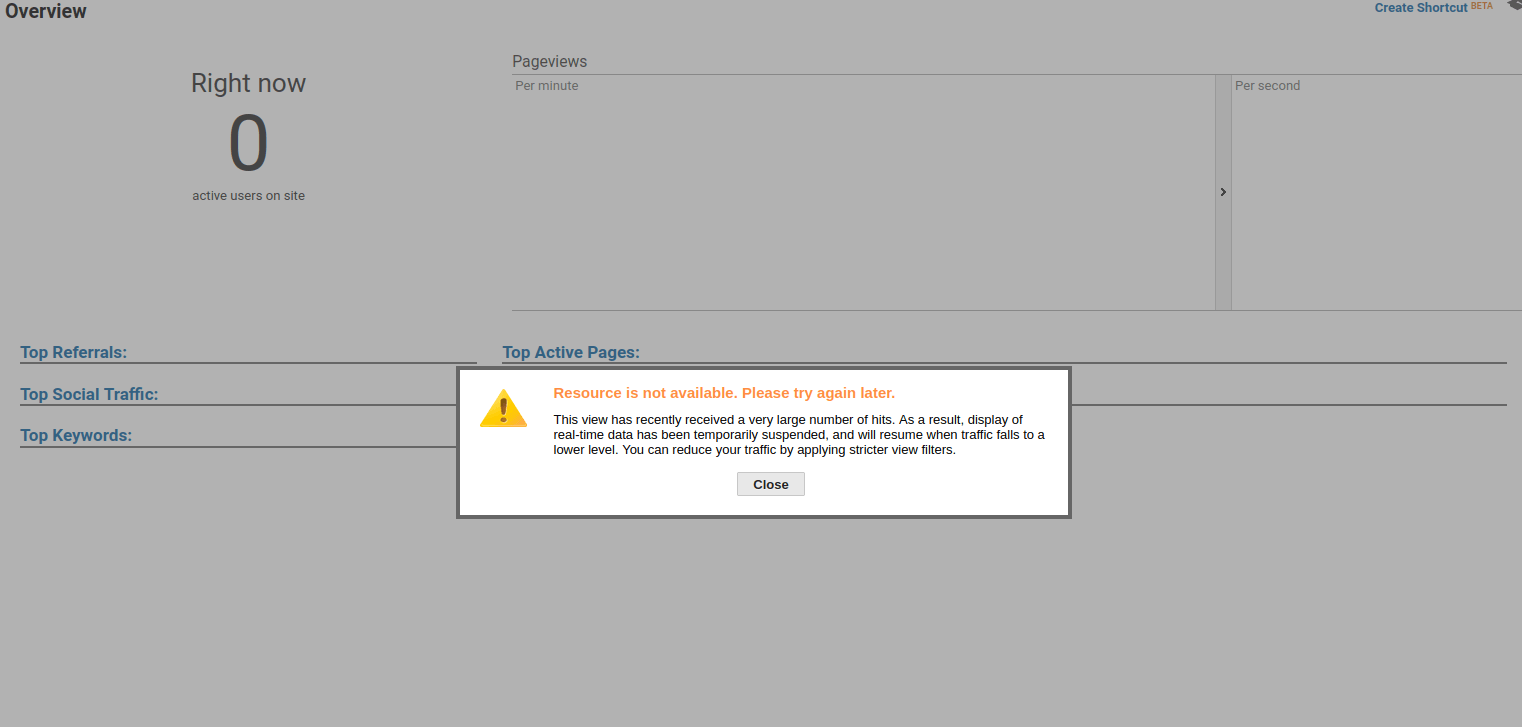
Google Analytics stopped showing the reports:
Depending on your API traffic, you might eventually hit the Google Analytics limits using a free account. Although these limits are usually high, if you have millions of requests every day, you might need to enable a Google Analytics 360 to avoid this problem. The error you’ll see is:
Memory consumption:
A reporting component like this one could be resource-intensive if improperly configured. However, the memory consumption of this component is very stable and goes from a few megabytes to around 800MB RAM on massive traffic (20,000 requests per second or more).
The memory could spike up if there are problems when reaching Google Analytics and the timeout is set higher than the default.