Document updated on Aug 30, 2022
Exporting metrics and events to InfluxDB
KrakenD can expose very detailed metrics to provide a monitoring dashboard. One of the richest monitoring solutions at the metrics level is the combination of krakend-metrics with the native krakend-influx exporter. The two components let you send detailed metrics to InfluxDB and draw them later on our preconfigured Grafana dashboard can feed from here and provide you a useful.
InfluxDB configuration
Notice that there are two different implementations of InfluxDB in KrakenD that are described in this document:
- Native InfluxDB exporter (recommended)
- OpenCensus InfluxDB exporter
Native InfluxDB configuration
Pushing data to InfluxDB using the native middleware requires adding two different configuration pieces:
- Enabling the extended metrics (collecting the information)
- Enabling InfluxDB (pushing the data)
You can accomplish it with the following snippet.
{
    "version": 3,
    "extra_config": {
      "telemetry/influx":{
          "address":"http://192.168.99.9:8086",
          "ttl":"25s",
          "buffer_size":0,
          "db": "krakend",
          "username": "your-influxdb-user",
          "password": "your-influxdb-password"
      },
      "telemetry/metrics": {
        "collection_time": "30s",
        "listen_address": "127.0.0.1:8090"
      }
    }
}address(string): The complete url of the influxdb including the port if different from defaults in http/httpsttl(duration): Valid time units are:ns(nanoseconds),usorµs(microseconds),ms(milliseconds),s(seconds),m(minutes - don’t!),h(hours - don’t!)buffer_size(integer): Use0to send events immediately or set the number of points that should be sent together.db(string): Name of the database or bucket, defaults to krakend.usernameandpasswordare optional and used to authenticate against InfluxDB.
See below how to configure InfluxDB, and you are ready to publish a Grafana dashboard.
OpenCensus InfluxDB exporter
InfluxDB is a time series database designed to handle high write and query loads.
The Opencensus exporter allows you export data to InfluxDB for monitoring metrics and events. Enabling it only requires you to add the influxdb exporter in the opencensus module.
The following configuration snippet sends data to your InfluxDB:
{
    "telemetry/opencensus": {
      "exporters": {
        "influxdb": {
            "address": "http://192.168.99.100:8086",
            "db": "krakend",
            "timeout": "1s",
            "username": "your-influxdb-user",
            "password": "your-influxdb-password"
        }
      }
    }
}addressis the URL (including port) where your InfluxDB is installed.dbis the database name.timeoutis the maximum time you will wait for InfluxDB to respond.usernameandpasswordare optional and used to authenticate against InfluxDB.
See also the additional settings of the Opencensus module that can be declared.
Connecting to Influx
The connection with InfluxDB v1.x is straightforward and requires you nothing else than starting an Influx instance with the desired configuration and adding the configuration above.
With the InfluxDB v2.x there are a few more steps you need to do the first time you run it.
Connecting to Influx v1
When using InfluxDB v1.x, you need to specify in the configuration above the same data you used to run InfluxDB. For instance, the following docker compose sets the credentials you need to reflect in the KrakenD configuration.
version: "3"
services:
  influxdb:
    image: influxdb:1.8
    environment:
      - "INFLUXDB_DB=krakend"
      - "INFLUXDB_USER=krakend-dev"
      - "INFLUXDB_USER_PASSWORD=pas5w0rd"
      - "INFLUXDB_ADMIN_USER=admin"
      - "INFLUXDB_ADMIN_PASSWORD=supersecretpassword"
    ports:
      - "8086:8086"
  krakend:
    image: devopsfaith/krakend
    volumes:
      - ./krakend:/etc/krakend
    ports:
      - "8080:8080"
In the fields db, username, and password of the component configuration reflect the same values as in INFLUXDB_DB, INFLUXDB_USER, and INFLUXDB_USER_PASSWORD accordingly.
Connecting to Influx v2
There are four steps you need to do to connect to an InfluxDB v2:
- Install or run an InfluxDB
- Setup InfluxDB for the first time
- Creating a configuration using a token
- Create a v1 authorization
Let’s see them in detail
Start an InfluxDB v2
If you use Docker you can start InfluxDB as part of a docker compose file, or independently. For instance:
Term
$docker run -it -d --name influxdb -p 8086:8086 influxdb:2.4Setup InfluxDB for the first time
Once InfluxDB is started, access with a web browser to http://localhost:8086 (or the server with InfluxDB), and click the Get Started button to begin the onboarding.
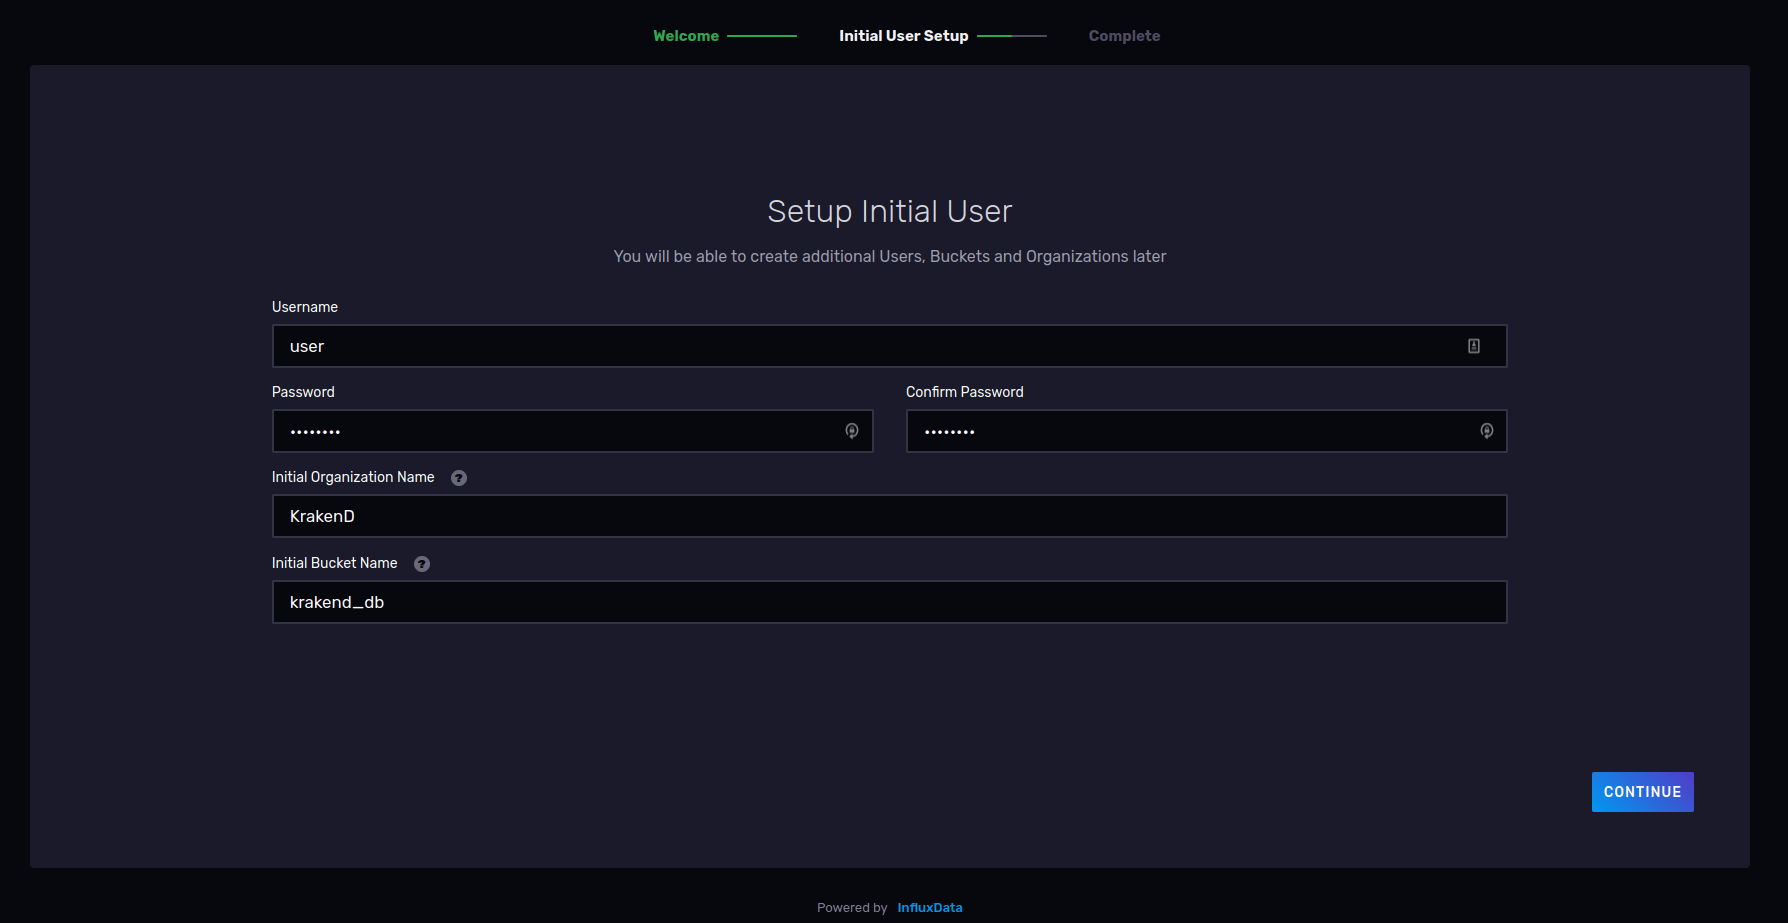
Create a username and password that KrakenD will use to connect and send the metrics. Write your organization name and a bucket name (database). Write down these values as you will need them later. Now InfluxDB is ready.
Create a configuration
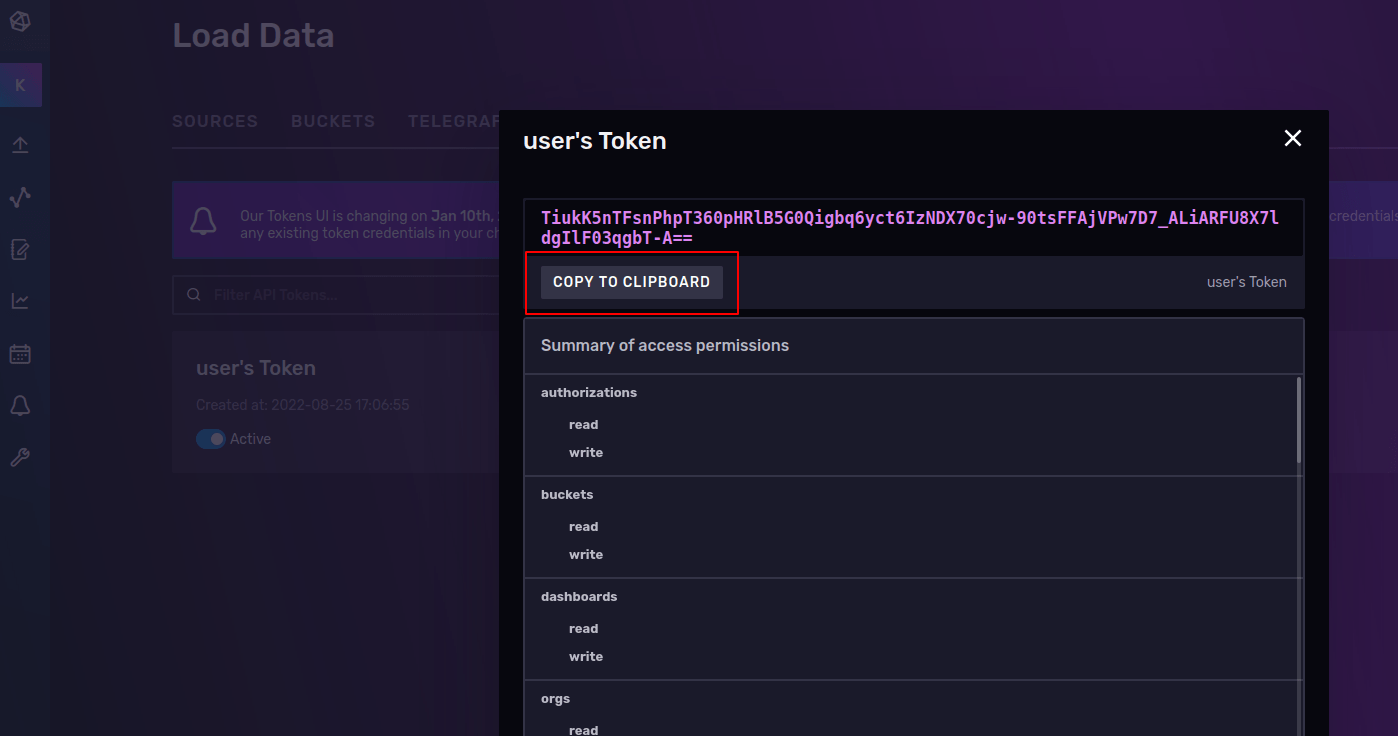
Select the Advanced button and go to the section API TOKENS.
Click on the title of the user’s Token and Copy to Clipboard, save it somewhere, you will use it in a minute.
The last step is to create the configuration and auth. For this, connect to the container’s shell:
Term
$docker exec -it influxdb /bin/bashAnd now create the configuration as follows:
Term
$influx config create --config-name krakend-config \
  --host-url http://localhost:8086 \
  --org KrakenD \
  --token TiukK5nTFsnPhpT360pHRlB5G0Qigbq6yct6IzNDX70cjw-90tsFFAjVPw7D7_ALiARFU8X7ldgIlF03qgbT-A== \
  --active
Make sure to replace the values below as follows:
config-nameis a random name to identify your configurationorgYour organization name as written during the setup of InfluxDBtokenThe one you copied in the step abovehost-urlThe address where the influxdb is running (inside Docker is as shown)
The final step is to create the auth for KrakenD.
Return to the InfluxDB UI and select BUCKETS. You’ll see that there is an ID next to the bucket you created during the Setup. Copy the bucket ID.
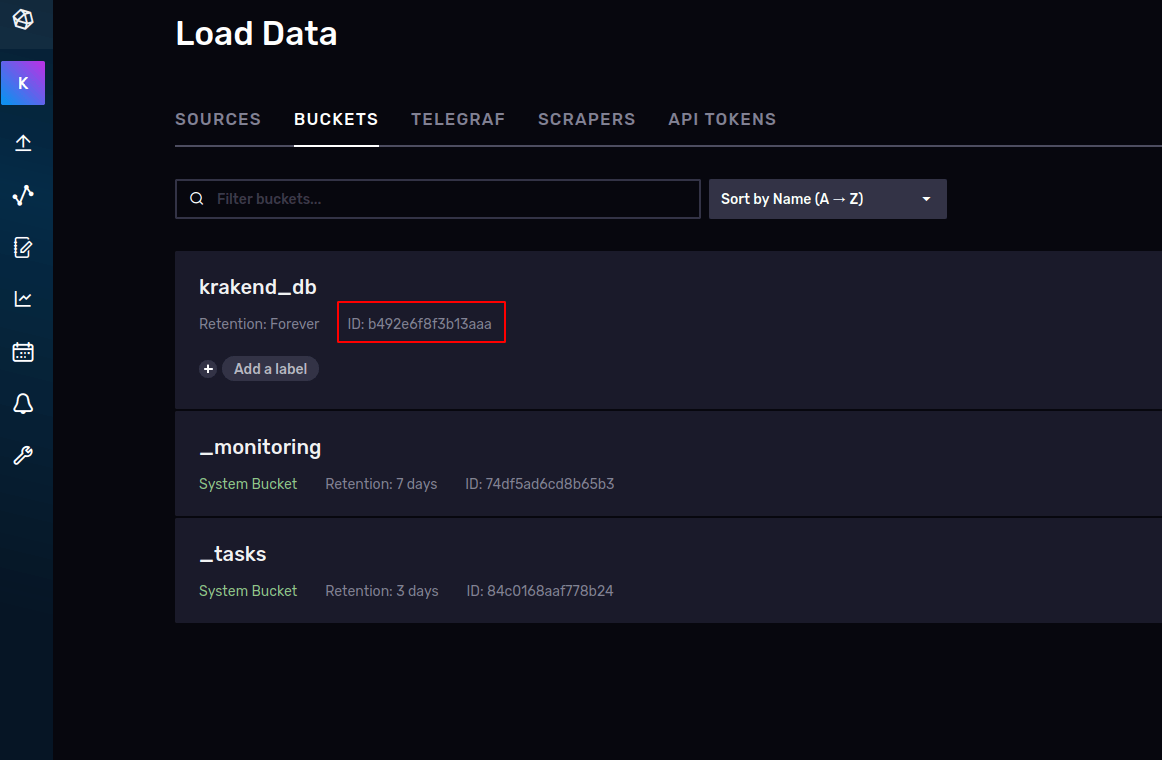
And now launch the last command in the shell:
Term
$influx v1 auth create \
  --read-bucket b492e6f8f3b13aaa
  --write-bucket b492e6f8f3b13aaa
  --username user
Replace the ID of the buckets above with the ID you just copied. The shell will ask for your password.
Now your configuration should work and start sending data to InfluxDB:
{
    "version": 3,
    "extra_config": {
        "telemetry/metrics": {
            "collection_time": "60s",
            "listen_address": ":8090"
        },
        "telemetry/influx": {
            "address": "http://localhost:8086",
            "ttl": "25s",
            "buffer_size": 100,
            "db": "krakend_db",
            "username": "user",
            "password": "password"
        }
    }
}
Make sure to type in db the bucket name you created on InfluxDB and the username and password as well.