Document updated on Nov 17, 2020
Preconfigured Grafana dashboard
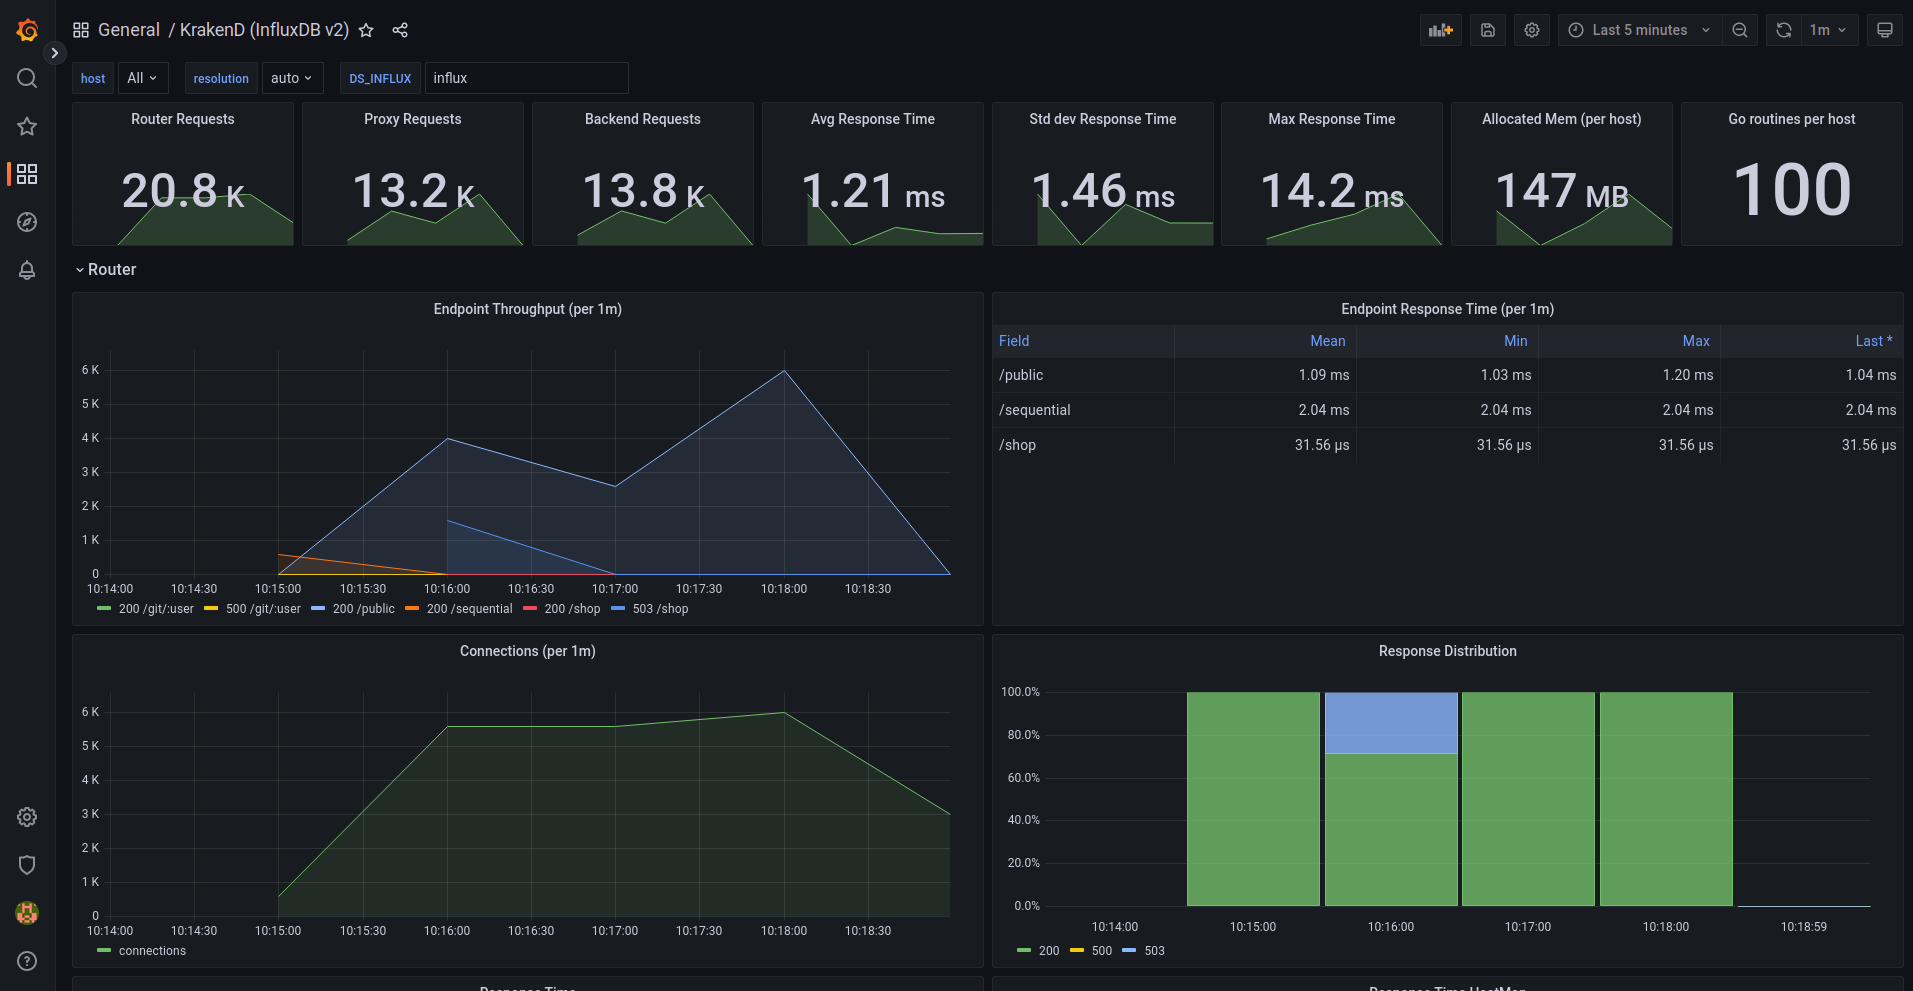
The preconfigured Grafana dashboard for KrakenD offers valuable information to understand the performance of your services and detect anomalies in the service.
The dashboard is extensive and offers you metrics like:
- Requests from users to KrakenD
- Requests from KrakenD to your backends
- Response times
- Memory usage and details
- Endpoints and status codes
- Heatmaps
- Open connections
- Throughput
- Distributions, timers, garbage collection and a long etcetera
Configure Grafana
Add the following configuration to your krakend.json at the root level:
{
  "version": 3,
  "extra_config": {
    "telemetry/influx":{
        "address":"http://192.168.99.9:8086",
        "ttl":"25s",
        "buffer_size":0
    },
    "telemetry/metrics": {
      "collection_time": "30s",
      "listen_address": "127.0.0.1:8090"
    }
  }
}
For more details of this configuration see the InfluxDb exporter
Then, import our Grafana dashboard for Krakend.
Importing the Grafana dashboard
To import the dashboard: From the Grafana UI, click the + icon in the side menu, and then click Import. Choose import via Grafana.com and use the ID 15029 .
Local testing with Docker
After adding your configuration to KrakenD, to test the configuration locally with Docker, you will need to:
- Start an InfluxDB:
Start InfluxDB
$docker run -p 8086:8086 \
	  -e INFLUXDB_DB=krakend \
	  -e INFLUXDB_USER=letgo -e INFLUXDB_USER_PASSWORD=pas5w0rd \
	  -e INFLUXDB_ADMIN_USER=admin -e INFLUXDB_ADMIN_PASSWORD=supersecretpassword \
	  -it --name=influx \
influxdb- Open the CLI:
CLI
$docker exec -it influx influx- Start Grafana:
Grafana
$docker run \
  -d \
  -p 3000:3000 \
  --name=grafana \
  grafana/grafana
Go to the browser and open http://localhost:3000. Use
adminfor both user and passwordFind the button to add the Data Source in the home screen. Select InfluxDB as the database and fill the details you provided when starting influxdb:
- URL:
http://localhost:8086 - Access:
Browser - database:
krakend - password:
supersecretpassword - HTTP Method :
GET
- Import the Dashboard via grafana.com. Type
15029and click on Load. The Dashboard will be ready for you!