Document updated on May 2, 2021
Extended Metrics API
The metrics API offers a new /__stats/ endpoint in a different port and contains a lot of metrics that you can scrape in a custom collector, or you can push them to InfluxDB.
This component is unrelated to the OpenTelemetry metrics, and they can coexist. Previous to the creation of OpenTelemetry, the combination of Influx and the metrics API, offered the older versions of Grafana dashboard.
Configuration
In order to add the metrics API to your KrakenD installation add the telemetry/metrics namespace under extra_config in the root of your configuration file, e.g.:
{
  "version": 3,
  "extra_config": {
    "telemetry/metrics": {
      "collection_time": "60s",
      "proxy_disabled": false,
      "router_disabled": false,
      "backend_disabled": false,
      "endpoint_disabled": false,
      "listen_address": ":8090"
    }
  }
}
Fields of Extended metrics
backend_disabledboolean- Skip any metrics happening in the backend layer. Disabling layers saves memory consumption but reduces visibility.Defaults to
false collection_timestring- The time window to consolidate collected metrics. Metrics are updated in their internal counters all the time, but the
/__stats/endpoint, or the Influx reporter, won’t see them updated until this window completes.Specify units usingns(nanoseconds),usorµs(microseconds),ms(milliseconds),s(seconds),m(minutes), orh(hours).Defaults to"60s" endpoint_disabledboolean- When true do not publish the /__stats/ endpoint. Metrics won’t be accessible via the endpoint but still collected (and you can send them to Influx for instance).Defaults to
false listen_addressstring- Change the listening address where the metrics endpoint is exposed.Defaults to
":8090" proxy_disabledboolean- Skip any metrics happening in the proxy layer (traffic against your backends). Disabling layers saves memory consumption but reduces visibility.Defaults to
false router_disabledboolean- Skip any metrics happening in the router layer (activity in KrakenD endpoints). Disabling layers saves memory consumption but reduces visibility.Defaults to
false
The structure of the metrics looks like this (truncated):
Sample of /__stats endpoint
$curl http://localhost:8090/__stats
{
  "cmdline": [
    "/usr/bin/krakend",
    "run",
    "-c",
    "/etc/krakend/krakend.json",
    "-d"
  ],
  "krakend.router.connected": 0,
  "krakend.router.connected-gauge": 0,
  "krakend.router.connected-total": 0,
  "krakend.router.disconnected": 0,
  "krakend.router.disconnected-gauge": 0,
  "krakend.router.disconnected-total": 0,
  "krakend.service.debug.GCStats.LastGC": 1605724147216402400,
  "krakend.service.debug.GCStats.NumGC": 102,
  "krakend.service.debug.GCStats.Pause.50-percentile": 0,
  "krakend.service.debug.GCStats.Pause.75-percentile": 0,
  "krakend.service.debug.GCStats.Pause.95-percentile": 0,
  "krakend.service.debug.GCStats.Pause.99-percentile": 0,
  "krakend.service.debug.GCStats.Pause.999-percentile": 0,
  "krakend.service.debug.GCStats.Pause.count": 0,
  "krakend.service.debug.GCStats.Pause.max": 0,
  "krakend.service.debug.GCStats.Pause.mean": 0,
  "krakend.service.debug.GCStats.Pause.min": 0,
  "krakend.service.debug.GCStats.Pause.std-dev": 0,
    ...
  }
}
Push metrics to InfluxDB
You can accomplish it with the following snippet.
{
    "version": 3,
    "extra_config": {
      "telemetry/influx":{
          "address":"http://influxdb:8086",
          "ttl":"25s",
          "buffer_size":0,
          "db": "krakend",
          "username": "your-influxdb-user",
          "password": "your-influxdb-password"
      },
      "telemetry/metrics": {
        "collection_time": "30s",
        "listen_address": "127.0.0.1:8090"
      }
    }
}
The properties of the telemetry/influx are as follows:
Fields of Telemetry via influx
address* string- The complete url of the influxdb including the port if different from defaults in http/https.
buffer_sizeinteger- The buffer size is a protection mechanism that allows you to temporarily store datapoints for later reporting when Influx is unavailable. If the buffer is
0, reported metrics that fail are discarded immediately. If the buffer is a positive number, KrakenD creates a buffer with the number of datapoints set. When the buffer is full because the Influx server keeps failing, newer datapoints replace older ones in the buffer. dbstring- Name of the InfluxDB database (Influx v1) or the bucket name (Influx v2).Defaults to
"krakend" passwordstring- Password to authenticate to InfluxDB. In Influx v2, you also need to add grant access with
influx v1 auth. ttl*- TTL against Influx.Specify units using
ns(nanoseconds),usorµs(microseconds),ms(milliseconds),s(seconds),m(minutes), orh(hours). usernamestring- Username to authenticate to InfluxDB.
See below how to configure InfluxDB, and you are ready to publish a Grafana dashboard.
Setting up Influx
For InfluxDB v2.x, we have included in our Telemetry Dashboards the files that create the authorization part.
For InfluxDB v1.x (older) the process is straightforward and requires you nothing else than start an Influx instance with the desired configuration.
Influx v2
If you use Docker, you can start InfluxDB as part of a docker compose file. You need to specify in the configuration above the same data you used to run InfluxDB. For instance, the following docker-compose.yml sets the credentials you need to reflect in the KrakenD configuration.
version: "3"
services:
  influxdb:
    image: influxdb:2.4
    environment:
      - "DOCKER_INFLUXDB_INIT_MODE=setup"
      - "DOCKER_INFLUXDB_INIT_USERNAME=krakend-dev"
      - "DOCKER_INFLUXDB_INIT_PASSWORD=pas5w0rd"
      - "DOCKER_INFLUXDB_INIT_ORG=my-org"
      - "DOCKER_INFLUXDB_INIT_BUCKET=krakend"
      - "DOCKER_INFLUXDB_INIT_RETENTION=1w"
      - "DOCKER_INFLUXDB_INIT_ADMIN_TOKEN=my-super-secret-auth-token"
    ports:
      - "8086:8086"
    volumes:
      - "./config/telemetry/influx:/docker-entrypoint-initdb.d"
  krakend:
    image: krakend/krakend-ee:2.13
    volumes:
      - ./krakend:/etc/krakend
    ports:
      - "8080:8080"
In the fields db, username, and password of the component configuration reflect the same values as in DOCKER_INFLUXDB_INIT_BUCKET, DOCKER_INFLUXDB_INIT_USERNAME, and DOCKER_INFLUXDB_INIT_PASSWORD accordingly.
The Influx volume below must have the contents of the influx initdb script, that it will create the authorization needed to let KrakenD push the metrics.
Manual configuration
If you don’t want to use the automated docker compose above, the manual steps to create the auth are:
Connect to your influx
Term
$docker exec -it influxdb /bin/bashCreate a configuration:
Term
$influx config create --config-name krakend-config \
  --host-url http://localhost:8086 \
  --org my-org \
  --token my-super-secret-auth-token \
  --active
Make sure to replace the values below as follows:
config-nameis a random name to identify your configurationorgYour organization name as written during the setup of InfluxDBtokenThe one you started influx withhost-urlThe address where the influxdb is running (inside Docker is as shown)
Access with a web browser to http://localhost:8086 and select BUCKETS from the UI. You’ll see that there is an ID next to the bucket you created during the Setup. Copy the bucket ID.
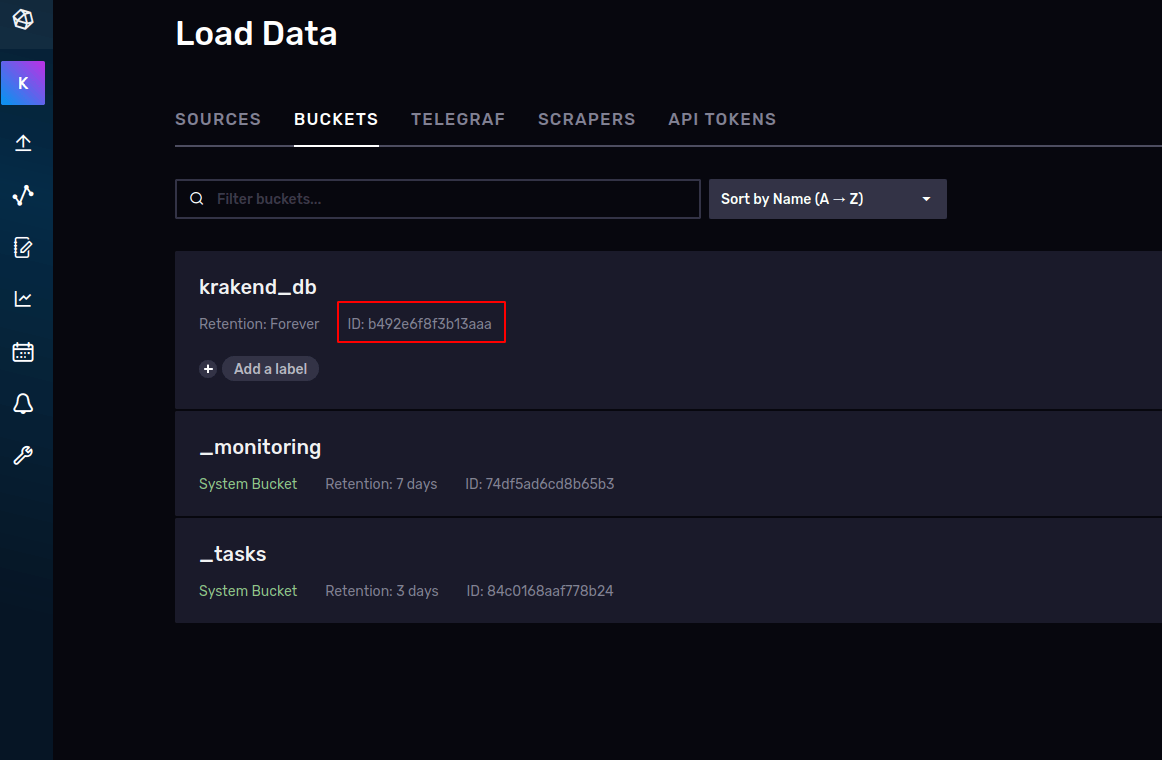
And now launch the last command in the shell:
Term
$influx v1 auth create \
  --read-bucket b492e6f8f3b13aaa \
  --write-bucket b492e6f8f3b13aaa \
  --username krakend-dev
Replace the ID of the buckets above with the ID you just copied, and the username as in the docker compose. The shell will ask for your password.
Now your configuration should work and start sending data to InfluxDB:
{
    "version": 3,
    "extra_config": {
        "telemetry/metrics": {
            "collection_time": "60s",
            "listen_address": ":8090"
        },
        "telemetry/influx": {
            "address": "http://localhost:8086",
            "ttl": "25s",
            "buffer_size": 100,
            "db": "krakend_db",
            "username": "user",
            "password": "password"
        }
    }
}
Make sure to type in db the bucket name you created on InfluxDB and the username and password as well.
Influx v1
When using InfluxDB v1.x, you need to specify in the configuration above the same data you used to run InfluxDB. For instance, the following docker compose sets the credentials you need to reflect in the KrakenD configuration.
version: "3"
services:
  influxdb:
    image: influxdb:1.8
    environment:
      - "INFLUXDB_DB=krakend"
      - "INFLUXDB_USER=krakend-dev"
      - "INFLUXDB_USER_PASSWORD=pas5w0rd"
      - "INFLUXDB_ADMIN_USER=admin"
      - "INFLUXDB_ADMIN_PASSWORD=supersecretpassword"
    ports:
      - "8086:8086"
  krakend:
    image: krakend/krakend-ee:2.13
    volumes:
      - ./krakend:/etc/krakend
    ports:
      - "8080:8080"
In the fields db, username, and password of the component configuration reflect the same values as in INFLUXDB_DB, INFLUXDB_USER, and INFLUXDB_USER_PASSWORD accordingly.